Figure 5.

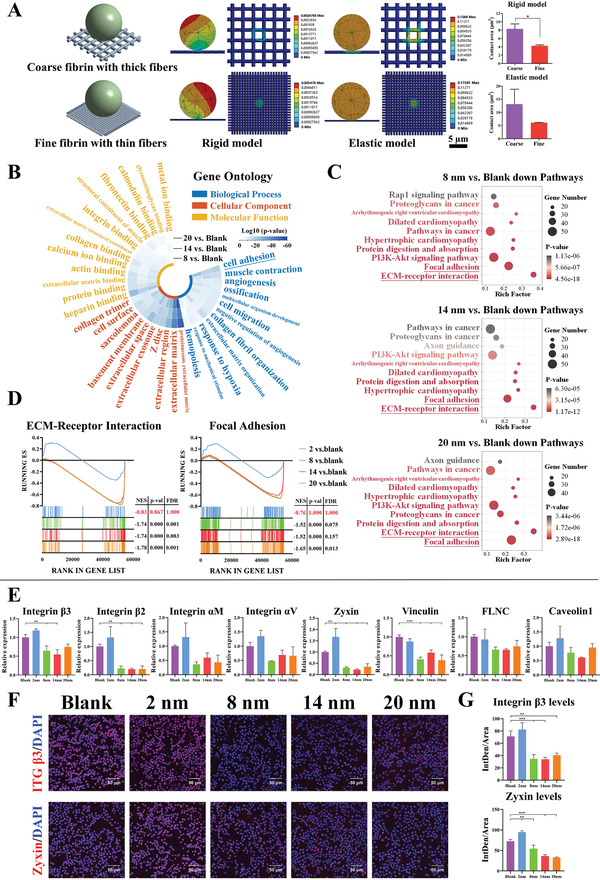
The adhesion behavior of macrophages is inhibited on generated fibrin network with thinner fibers. A) Finite element analysis shows the cell–fibrin contact area in rigid and elastic models. B) GO analysis reveals the Top10 terms enriched in differentially downregulated genes (including 8, 14, and 20 nm vs Blank) for biological process, cellular component, and molecular function. Tile color, log10 (p‐value). C) KEGG analysis reveals the Top10 pathways enriched in differentially downregulated genes (including 8, 14, and 20 nm vs Blank). X‐axis, rich factor; Y‐axis, enriched terms; dot sizes, gene number; dot color, p‐value. D) GSEA reveals the global difference in 2, 8, 14, and 20 nm vs Blank of ECM‐Receptor Interaction and Focal Adhesion. |NES| > 1, NOM p‐val < 0.05 and FDR q‐val < 0.25 are considered significant. E) RT‐qPCR results of adhesive receptors and focal adhesion related gene expressions in macrophages cultured on fibrin network. F–G) Representative immunofluorescence images and semi‐quantitative statistical analysis of integrin β3 (one of adhesive receptors for fibrin) and zyxin (one of focal adhesion genes) in macrophages cultured on fibrin network. Data are presented as means ± s.d.; n = 3; *p < 0.05, **p < 0.01, ***p < 0.001 by unpaired two‐tailed Student's t‐test or one‐way ANOVA with Tukey's post hoc test.
