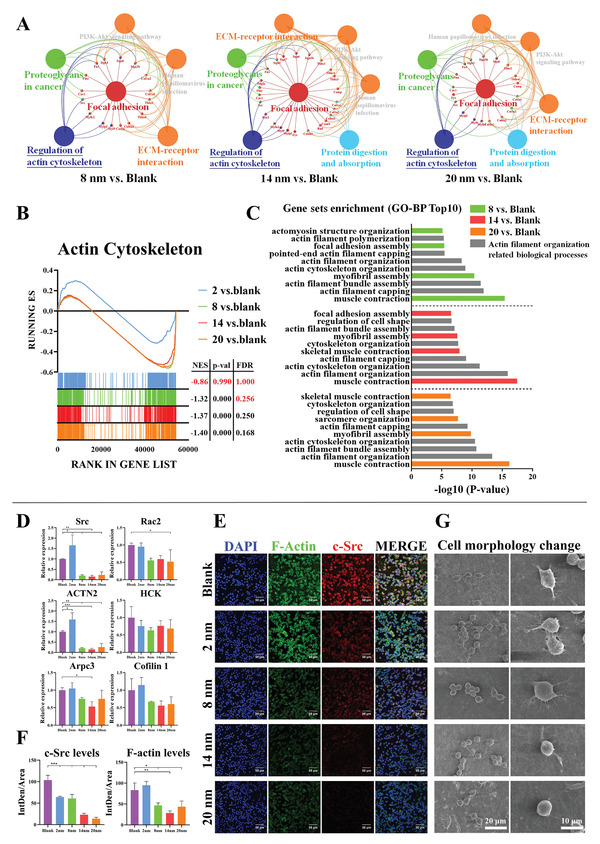
Figure 6.

The adhesion‐mediated actin cytoskeleton assembly of macrophages is inhibited on generated fibrin network with thinner fibers. A) The functional enrichment analysis of adhesion downregulated genes from 8, 14, and 20 nm versus Blank using ClueGO, a plug‐in of Cytoscape. B) GSEA reveals the global difference in 2, 8, 14, and 20 nm versus Blank of actin cytoskeleton of GO cellular component. |NES| > 1, NOM p‐val < 0.05 and FDR q‐val < 0.25 are considered significant. C) Bar diagram shows the Top10 biological process enrichment items of downregulated actin cytoskeleton key genes from 8, 14, and 20 nm versus Blank. The gray items represent actin filament organization related biological processes. D) RT‐qPCR results of actin filament assembly related gene expressions in macrophages cultured on fibrin network. E,F) Representative immunofluorescence images and semi‐quantitative statistical analysis of F‐actin (assembled filamentous actin) and c‐Src (one of key signaling molecules regulating F‐actin assembly) in macrophages cultured on fibrin network. G) Representative SEM images of cell morphology change of macrophages cultured on fibrin network. Data are presented as means ± s.d.; n = 3; *p < 0.05, **p < 0.01, ***p < 0.001 by one‐way ANOVA with Tukey's post hoc test.
