
Figure 2.
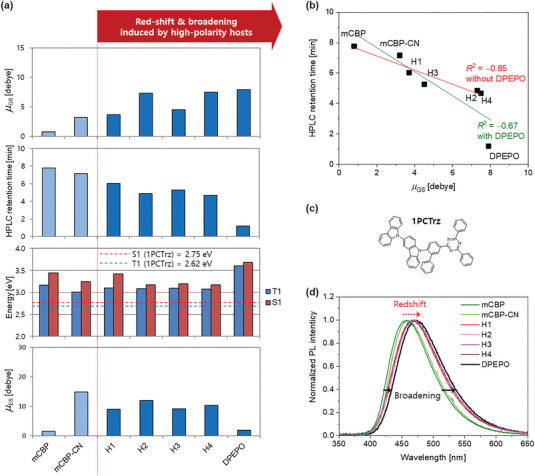
Increased host polarity correlates with reduced HPLC retention time and redshifted and broadened photoluminescence (PL) spectra. a) Calculated values of ground‐state dipole moments, μ GS (first panel); HPLC retention time (second panel); T 1 and S 1 energies (third panel) and calculated values of excited‐state dipole moments; μ ES (fourth panel) of the hosts. b) Correlation between ground‐state dipole moment and HPLC retention time. c) Chemical structure of TADF emitter, 1PCTrz. d) Photoluminescence spectra of 1PCTrz in the various host materials. The compositional ratio of host/1PCTrz is 85/15 by volume and the film thickness is 50 nm for all the films. Compared to the emission peaks of 1PCTrz in mCBP and mCBP‐CN, those in H1–H4 and DPEPO are redshifted (red dotted arrow) and broadened (black solid arrows). μ GS, μ ES, T 1, and S 1 are represented as the values corresponding to the minimum energy structure for each host (see also Figure S9, Supporting Information).