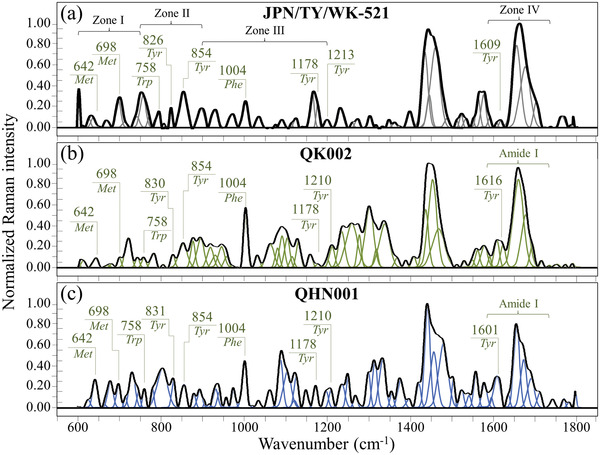
Figure 1.

Raman spectra in the frequency interval 600–1800 cm−1 of a) the original Japanese isolate JPN/TY/WK‐521, b) variant QK002, and c) variant QHN001. Spectra are normalized with respect to the Amide I signal and deconvoluted into Gaussian‐Lorentzian band components according to Equation (m‐1) in Methods. Four Zones are emphasized in a) and labels show frequencies at maximum of selected bands (Met, Tyr, and Phe are abbreviations for methionine, tyrosine, and phenylalanine, respectively).
