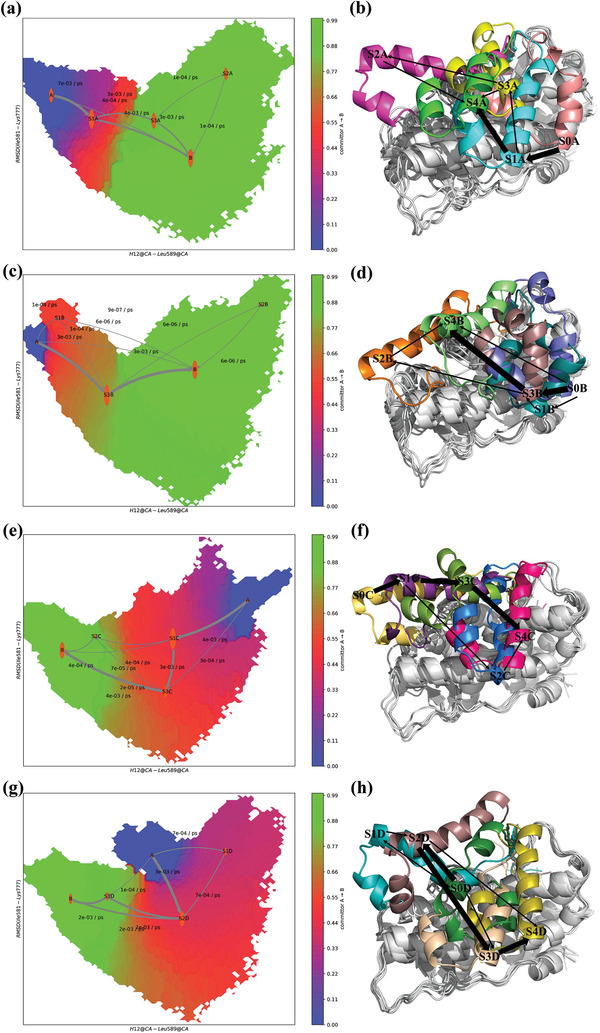
Figure 5.

Conformational conversion pathway of H12. a) The transformation pathway network in apo‐LBD. The weights of the arrows indicate the transition probability between states, and labels upon the arrows denote the proportion of flux in the current segment. The size of each state is proportional to the life time of the corresponding state. b) Structures of the main pathways in apo‐LBD. c) The transformation pathway network in dex‐LBD. d) Structures of the main pathways in dex‐LBD. e) The transformation pathway network in azd‐LBD. f) Structures of the main pathways in azd‐LBD. g) The transformation pathway network in ru486‐LBD. h) Structures of the main pathways in ru486‐LBD.
