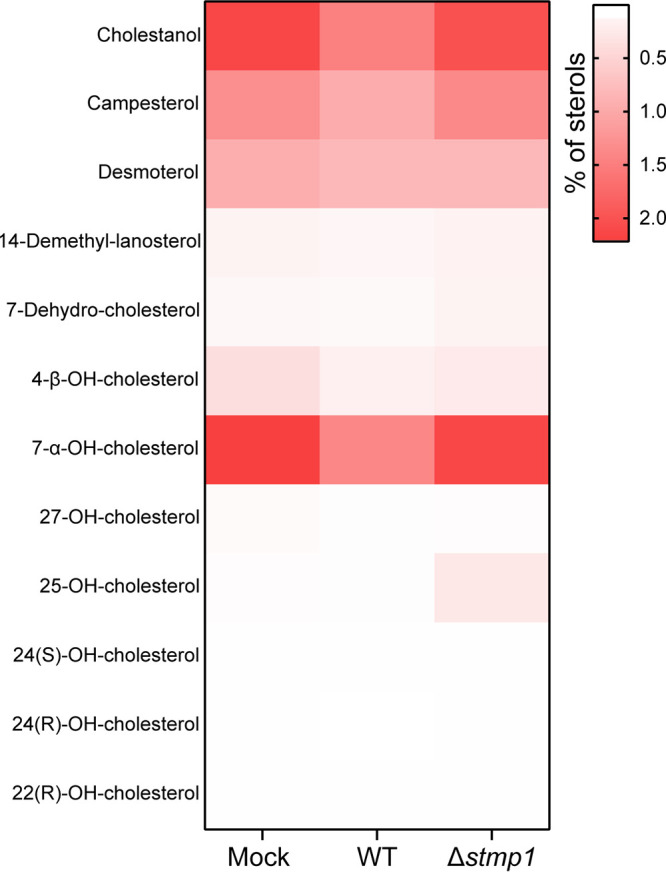
FIG 7.

25-HC accumulates in C. burnetii Δstmp1 mutant-infected cells. Heat map of the percentage of sterols in mock-, mCherry-expressing WT-, or Δstmp1 mutant-infected MH-S cells at 3 dpi. Data are shown as mean values from four independent experiments and normalized to the number of cells. Statistical significance was determined by one-way ANOVA with Dunnett’s post hoc test.
