FIG 8.
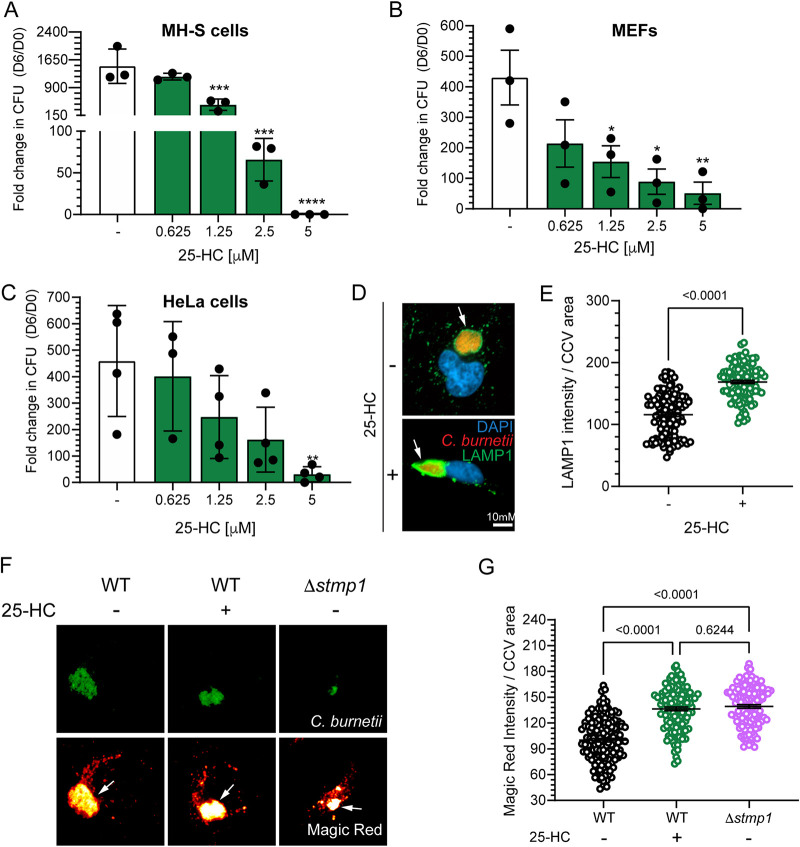
25-HC blocks C. burnetii growth by increasing proteolytic activity in the CCV. (A to C) 25-HC inhibits C. burnetii growth in a concentration-dependent manner in (A) MH-S macrophages, (B) DHCR24−/− MEFs, and (C) HeLa cells. Cells were infected with C. burnetii WT and treated with vehicle control (–) or different 25-HC concentrations (0, 0.625, 1.25, 2.5, or 5 μM). The fold change in growth over day 0 was determined by CFU assay at 6 dpi. Statistical significance was determined by one-way ANOVA test with Dunnett’s post hoc test; *, P < 0.05; **, P < 0.01, ***, P < 0.005; ****, P < 0.001. (D) Representative immunofluorescence images of C. burnetii CCVs (arrows) stained for LAMP1 at 3 dpi in HeLa cells. (E) Quantitation of CCV LAMP1 intensity, normalized to CCV area, indicates 25-HC CCVs have more LAMP1. Each circle represents an individual CCV. Data are shown as the mean ± SEM of at least 30 CCVs per condition in each of three independent experiments. Statistical significance was determined by t test. (F) Representative images of HeLa cells infected with clover-expressing WT or Δstmp1 mutant bacteria, treated with vehicle control or 25-HC (5 μM) 24 h before imaging. Infected cells were stained with cathepsin B Magic Red at 3 dpi to visualize proteolytically active lysosomes. Magic Red is shown as a heat map, with white showing the highest intensity and red showing the lowest intensity. The white arrows point to the CCVs. Bars = 10 μm. (G) Quantification of Magic Red shows that Δstmp1 CCVs and WT CCVs treated with 25-HC are more proteolytically active than untreated WT CCVs. Magic Red intensity was measured using ImageJ and normalized to CCV area. Each circle represents an individual CCV. Data are shown as the mean ± SEM of at least 30 CCVs per condition in each of three independent experiments. Statistical significance was determined by one-way ANOVA with Dunnett’s post hoc test.

