FIG 2.

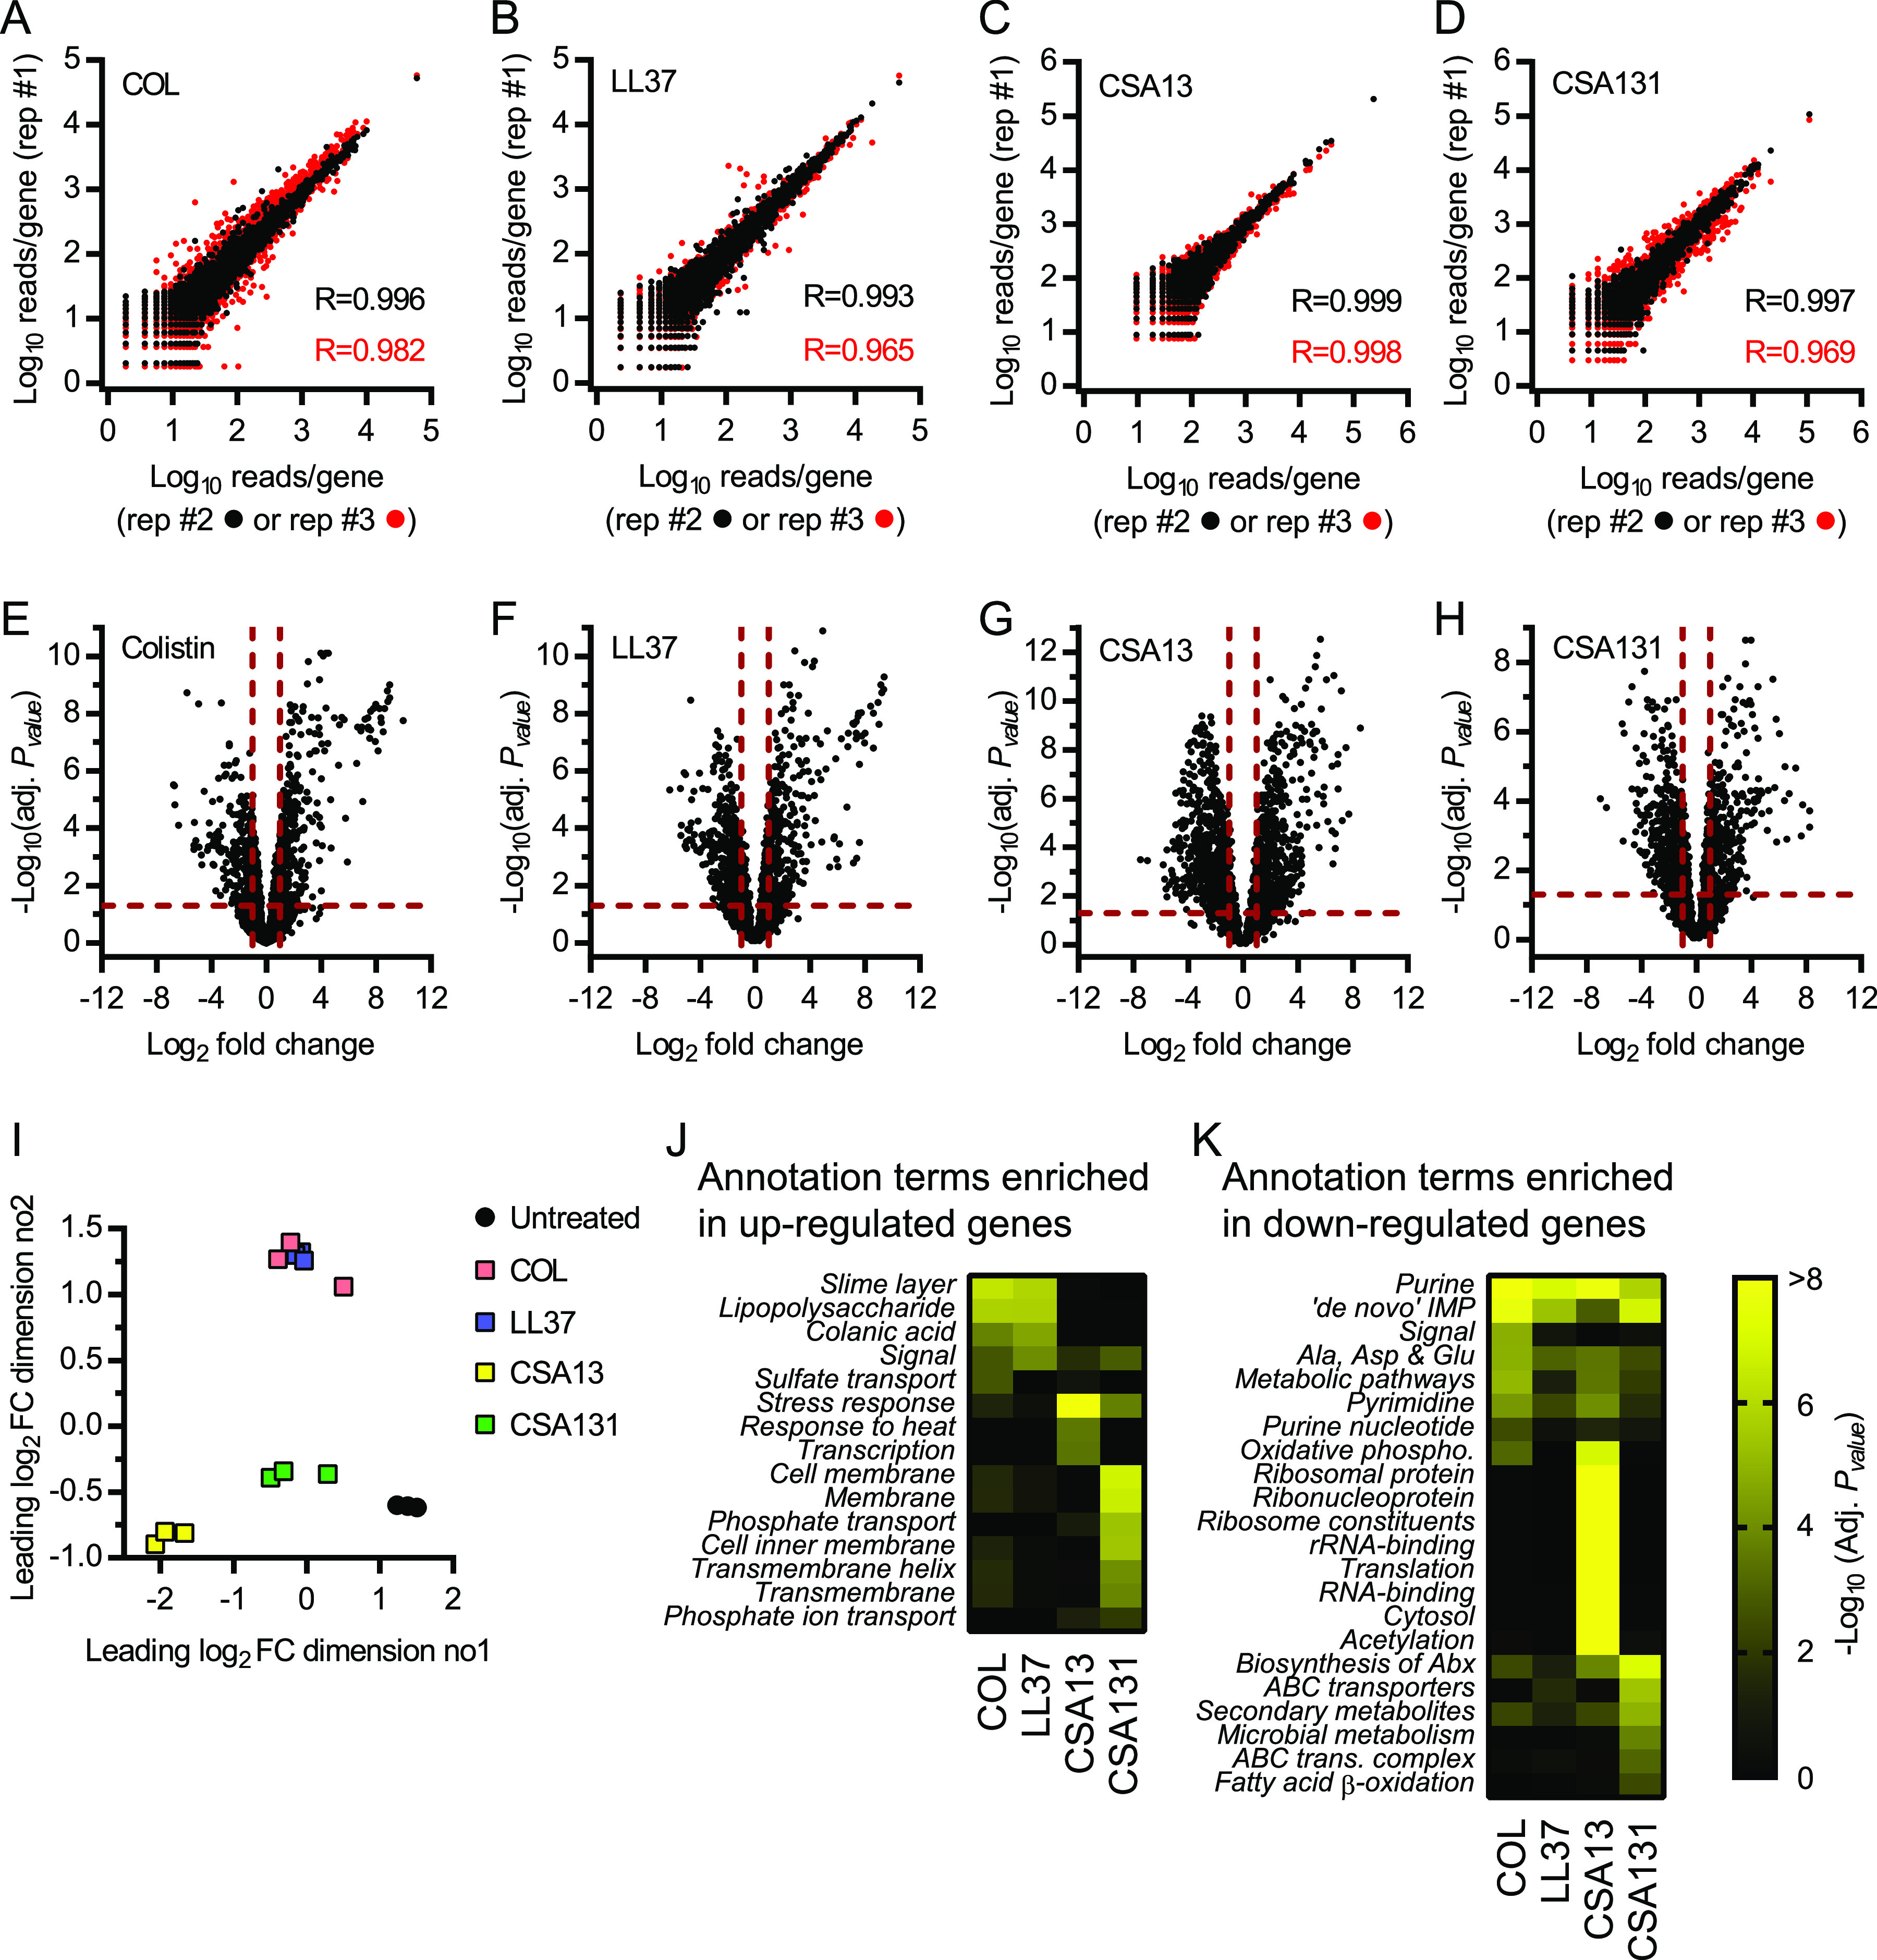
Transcriptional response of E. coli exposed to ceragenins. RNA from exponentially growing E. coli bacteria exposed to supra-MICs of colistin (COL), LL37, CSA13, and CSA131 was extracted and sequenced. (A–D) Replica plots showing the log10 of the normalized number of reads per gene for bacteria exposed to antibiotics. Correlation coefficients (R) between replicates #1 and #2 (black dot) and #1 and #3 (red dot) are displayed. (E-H) Volcano plots that represent RNA expression as means of log2-fold change and -log10 adjusted P values (adj. P value) for bacteria exposed to antibiotics in comparison to untreated control samples. Horizontal and vertical dotted red lines indicate adjusted P values less than 0.05 (or −log10 [adj. P value] greater than 1.3) and absolute log2-fold change greater than 1. (I) Multidimensional scaling (MDS) plot showing the separation between biological replicates and between untreated and antibiotic-treated samples. (J) Annotation terms enriched for genes significantly upregulated (log2 FC > 1 and adj. P value <0.05) following exposure to antibiotics. (K) Annotation terms enriched for genes significantly downregulated (log2 FC <−1 and adj. P value <0.05) following exposure to antibiotics. Adjusted P values of annotation terms associated with a false discovery rate (FDR) value >0.05 for at least one antibiotic are shown. Only the 8 most statistically significant annotation terms are shown for each condition. Annotation terms are abbreviated and/or modified for a purpose of presentation (see Data Set S2 for original annotation terms). Data are from 3 independent experiments.
