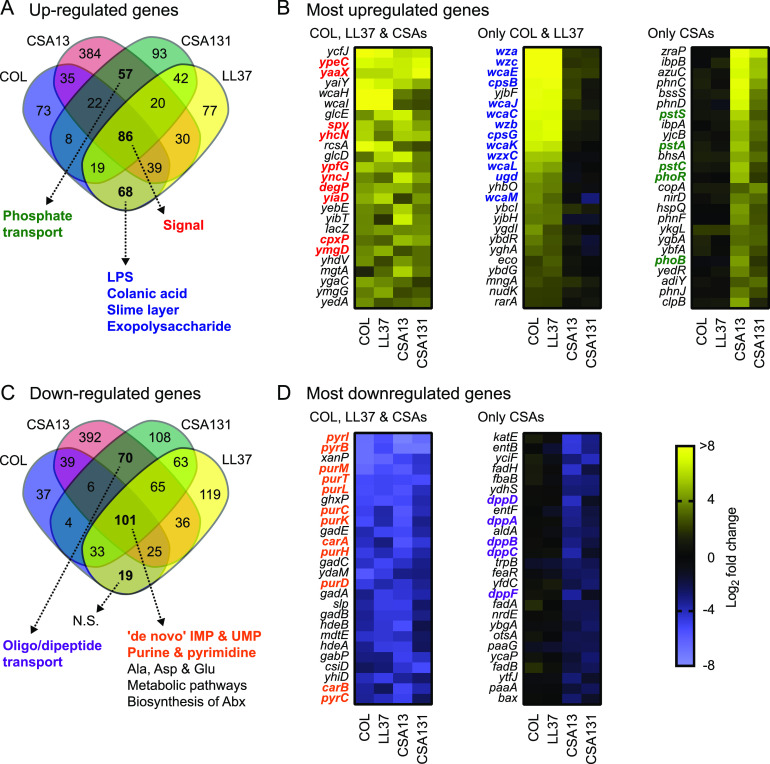
FIG 3.
Identification of pathways defining the transcriptional response of E. coli to ceragenins. (A) Venn diagram analysis of genes significantly upregulated (log2 FC >1 and adjusted P value <0.05) in E. coli exposed to antibiotics. Annotation terms associated with a false discovery rate (FDR) value > 0.05 for genes upregulated by all antibiotics, by CAMPs, or by ceragenins are shown by dotted arrows. (B) Top 25 most upregulated genes for bacteria exposed to all antibiotics (COL, LL37 & CSAs), CAMPs (COL & CSAs), or ceragenins. Genes belonging to the annotation terms signal (in red), LPS, colanic acid, slime layer, and exopolysaccharide (in blue), and phosphate transport (in green) are indicated. (C) Venn diagram analysis of genes significantly downregulated (log2 FC <−1 and adjusted P value <0.05) in E. coli exposed to antibiotics. Annotation terms associated with a false discovery rate (FDR) value > 0.05 for genes downregulated by all antibiotics, by CAMPs, or by ceragenins are shown by dotted arrows. (D) Top 25 most downregulated genes for bacteria exposed to all antibiotics or ceragenins. Genes belonging to the annotation terms “de novo IMP”, “de novo UMP”, “purine”, and “pyrimidine” (in orange), and “oligonucleotide/dipeptide transport” (in purple) are indicated. Annotation terms are abbreviated and/or modified for a purpose of presentation (see Data Set S3 for original annotation terms). Data are from 3 independent experiments.

