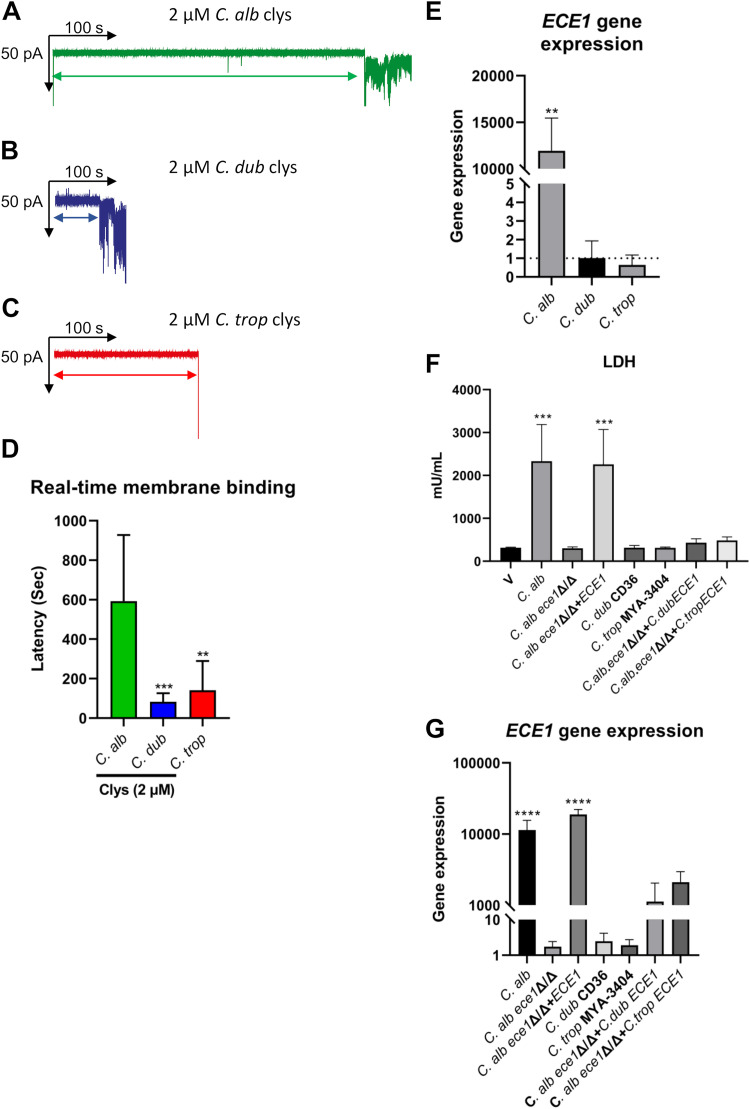
FIG 4.
Candidalysins exhibit differences in real-time membrane permeabilization, and C. albicans, C. dubliniensis, and C. tropicalis fungi exhibit differences in ECE1 gene expression. (A to C) Individual representative traces quantifying the dwell time (defined as the time that elapsed between candidalysin addition and bilayer permeabilization) for C. albicans (A), C. dubliniensis (B), and C. tropicalis (C) candidalysins at 2 μM. (D) Comparison of average dwell times for 2 μM candidalysins from C. albicans, C. dubliniensis, and C. tropicalis. Data are presented as means and SD from 10 biological repeats. Statistical significance was calculated using a two-tailed unpaired t test (versus C. albicans candidalysin). ***, P ≤ 0.001; **, P ≤ 0.01. (E) ECE1 gene expression in C. albicans, C. dubliniensis, and C. tropicalis was quantified in the presence of epithelial cells by RT-qPCR after 24 h. Gene expression is presented relative to the 0-h samples cultured in YPD medium at 30°C in the absence of epithelial cells (dotted line). The fold change (2ΔΔCT) was calculated for each strain using the threshold cycle method in comparison to ACT1 as the reference gene. Data are the means and SD from 3 biological replicates. Statistical significance was calculated using a two-tailed unpaired t test (versus the time zero control). **, P ≤ 0.01. (F) TR146 oral epithelial cells were infected with C. albicans expressing C. dubliniensis ECE1 (C.alb.ece1Δ/Δ+C.dubECE1) and C. tropicalis ECE1 (C.alb.ece1Δ/Δ+C.tropECE1) for 24 h, and levels of cell damage were assessed by an LDH assay. Statistics are applied relative to vehicle-treated cells. Data are the means and SD from 3 biological repeats. (G) ECE1 gene expression in the C.alb.ece1Δ/Δ+C.dubECE1 and C.alb.ece1Δ/Δ+C.tropECE1 mutants was quantified in the presence of epithelial cells by RT-qPCR after 24 h. Gene expression is presented relative to the 0-h samples cultured in YPD medium at 30°C in the absence of epithelial cells. The fold change (2ΔΔCT) was calculated for each strain using the threshold cycle method in comparison to ACT1 as the reference gene. Data are the means and SD from 3 biological replicates. Statistical significance in panels F and G was calculated using one-way ANOVA with Tukey’s post hoc comparison test. ****, P ≤ 0.0001; ***, P ≤ 0.001.

