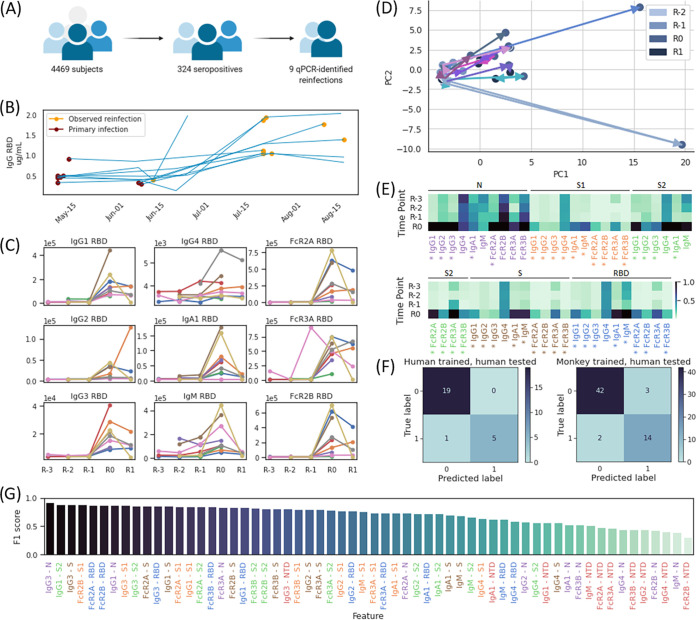
FIG 4.
Immune response to and discriminating biomarkers for primary infection and reinfection in humans. Cases identified through a community-based surveillance survey with R0 defined as the serum sample associated most closely with time of putative reinfection, R-1, R-2, and R-3, defined as the first, second, and third serum samples preceding reinfection, and R1, defined as the serum sample immediately after R0; for each subject, the earliest included time point is the first recorded seropositive sample. (A) Pictogram of community-based serological surveillance. (B) ELISA titers to IgG RBD in each PCR-confirmed subject collected at different time points between 12 May 2020 and 19 August 2020, with time points of first recorded seropositivity and observed reinfection denoted by purple and gold markers, respectively. (C) IgG1, Ig2, IgG3, IgG4, IgGA1, IgM, FcR2A binding, FcR3A binding, and FcR2B binding titers to RBD antigen as a function of collected time point in each subject. (D) Principal-component analysis (PCA) plot of human trajectories, with trajectories of different subjects indicated with differently colored arrows. We note that the color gradient of markers from light blue to dark blue reflects the timeline, with serum samples at R-2 marked by light blue circles and samples at R1 marked by dark blue circles. (E) Heatmap of collected Luminex and functional features across the respective time points in each subject. An asterisk indicates differential expression between week R-1 and R0 with a false discovery rate of 5%. (F) Confusion matrix of two-feature logistic regression models trained and tested in humans (left) and trained in rhesus macaques and tested in humans (right). (G) F1 scores of all relative change-based binary classifiers trained and tested in humans, with labels colored by antigen.

