FIG 7.
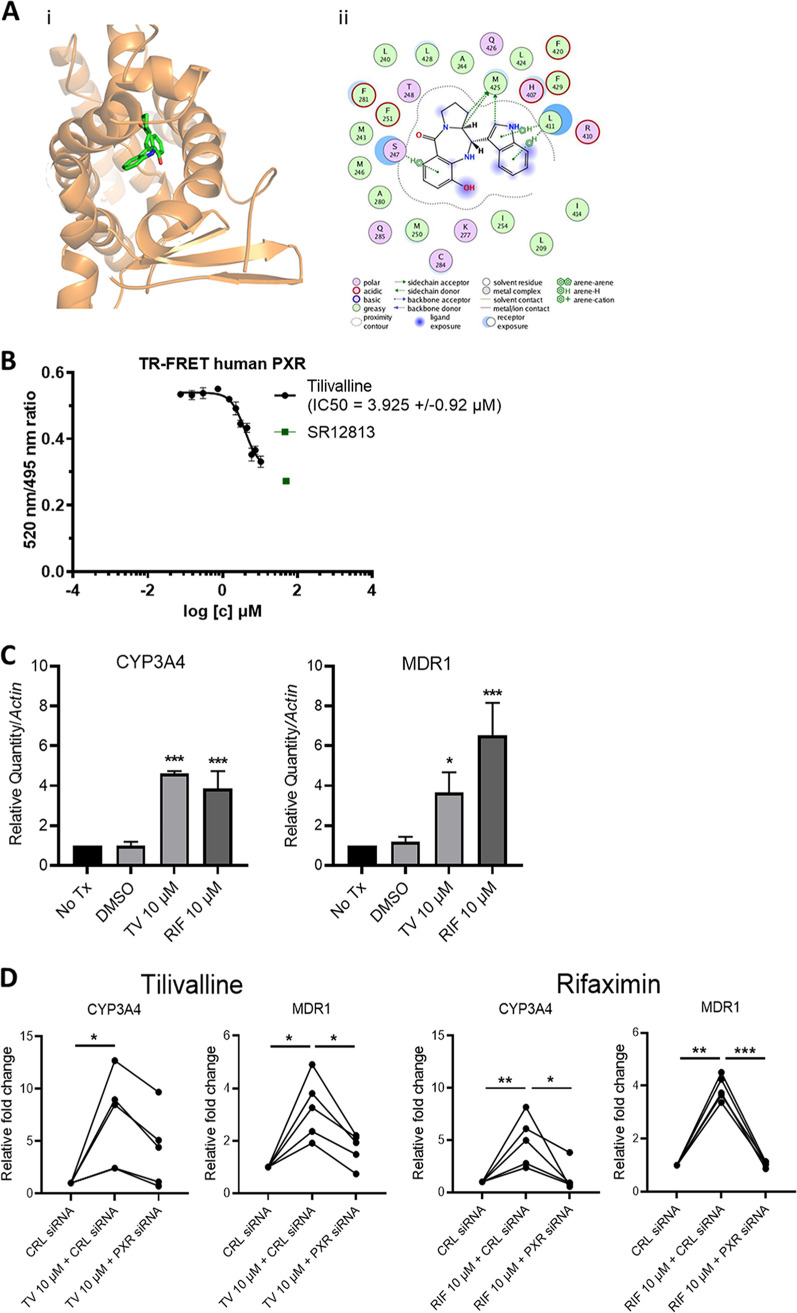
Tilivalline is a PXR agonist. (A) Docked complex of tilivalline with PXR. (i) Three-dimensional representation with PXR represented as ribbons and colored orange, while tilivalline is represented as licorice sticks and colored atom type (C, green; N, blue; and O, red). Hydrogen atoms have been removed for clarity. (ii) Schematic representation of the interactions of tilivalline with the ligand binding domain of PXR drawn using the ligand interaction module of MOE. The schematic legend at the bottom explains the types of interactions. (B) LanthaScreen TR-FRET PXR competitive binding assay. TR-FRET ratios (520/495 nm) are plotted against concentrations of tilivalline and SR12813. Half-maximal inhibitory concentrations (IC50s) were obtained from interpolated standard curves (sigmoidal, 4PL, variable slope); error bars show standard deviations (n = 3 or 4). (C) Relative mRNA levels for cyp3A4 and mdr1 in LS180 cells treated with tilivalline (TV) (10 μM), rifaximin (RIF) (10 μM; positive control), or DMSO (0.1% [vol/vol]; vehicle) determined by RT-qPCR. Data represent mean values ± standard errors of the means (n = 3 or 4). Tx, treatment. (D) Changes in cyp3A4 and mdr1 mRNA levels following treatment with TV (10 μM) or RIF (10 μM) in LS180 cells transfected with control (CRL) or PXR siRNA (n = 5). For panels C and D, statistical analysis was done by one-way ANOVA with multiple comparisons. *, P ≤ 0.05; **, P ≤ 0.01; ***, P ≤ 0.001.

