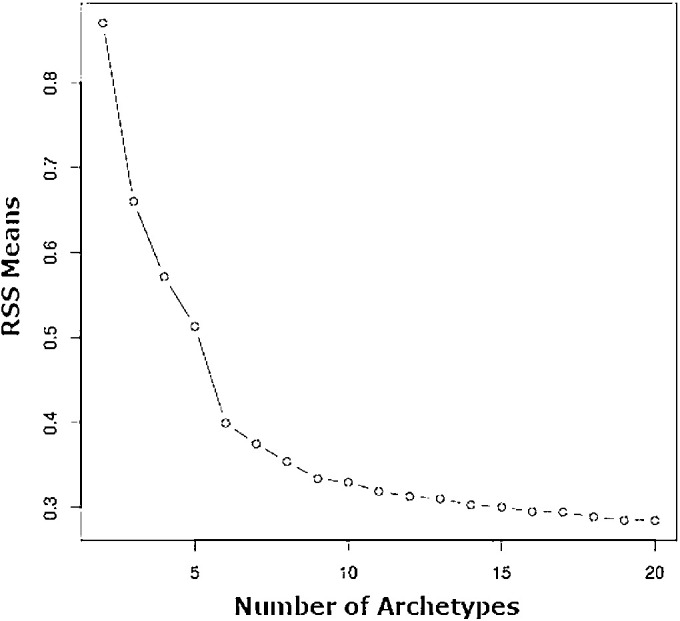
Figure 1.

Residual sum of squares (RSS) plot generated during AA for the purposes of selecting the number of ATs. RSS values were normalized based on sample size. The final number of ATs for our model was selected based on the point at which this curve begins to flatten, to avoid overfitting; resulting in the selection of a 16-AT model.
