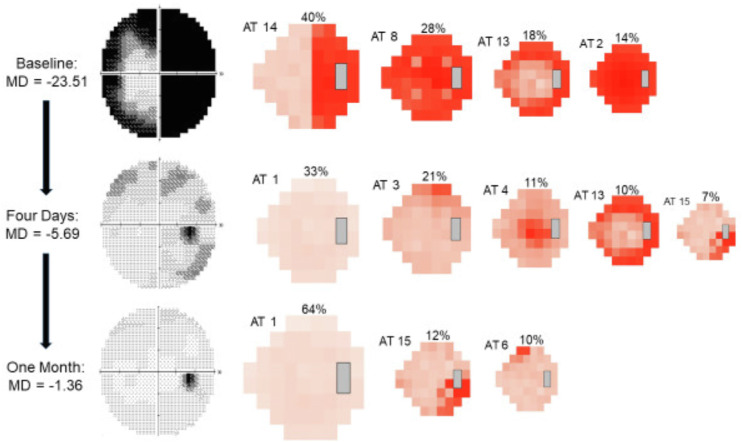
Figure 3.
Example of VF decompositions from baseline to one month. The progressive changes in AT weighting and MD at each time point are displayed, along with the corresponding grayscale image from the Humphrey VF plot. AT weights not considered to be meaningful (< 7% at any time point) are not shown. Both MD and AT weights improved (weights of worse ATs decreased, weights of better ATs increased) starting at the 4-day visit after treatment with intravenous methylprednisolone.

