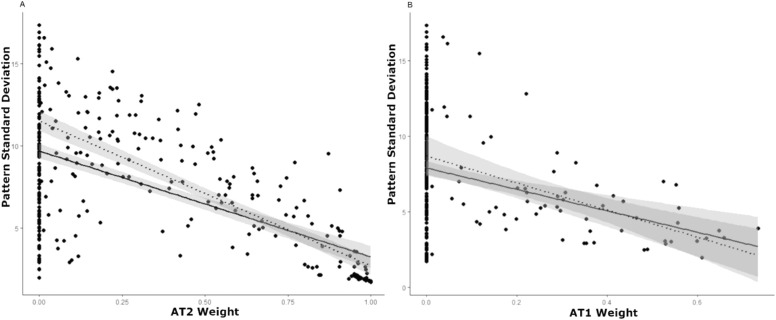
Figure 7.
(A) Correlation between AT2 weight and PSD (dB) at baseline (r = −0.53; P < 0.001). The dotted line represents the same correlation when eyes for which AT2 = 0% at baseline are eliminated (r = −0.79; P < 0.001). Note the wide range of abnormal PSD values, when diffuse severe VF loss AT2 is 0%. (B) Correlation between AT1 weight and PSD (dB) at baseline (r = −0.2; P < 0.001). The dotted line represents the same correlation when eyes for which AT1 = 0% at baseline are eliminated (r = −0.49; P < 0.001). Note the wide range of abnormal PSD values, when the normal VF AT1 is 0%.

