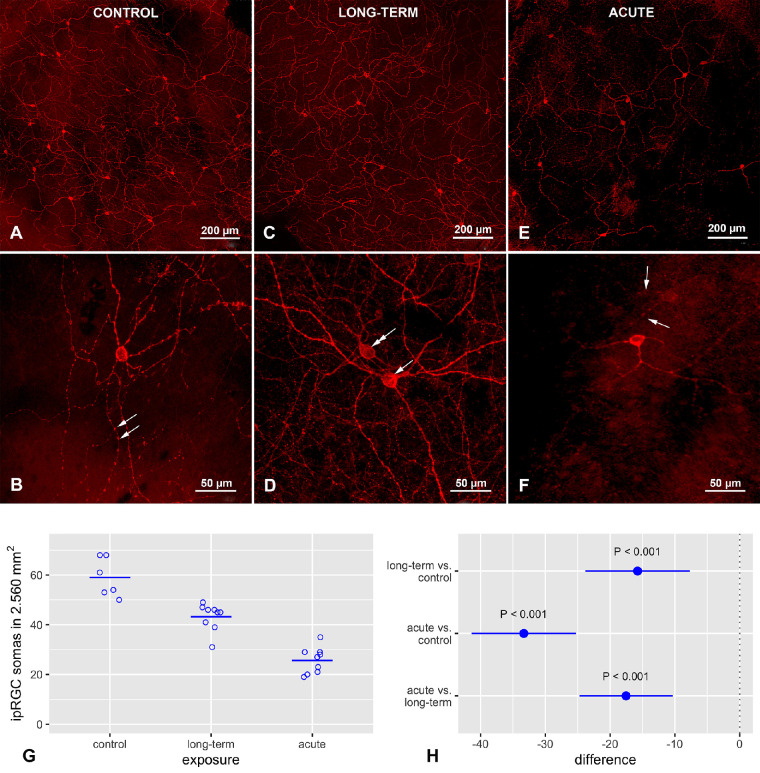
Figure 2.
Effect of blue light exposure on melanopsin distribution in intrinsically photoreceptive retinal ganglion cells (ipRGCs) in whole mount retinas from Brown Norway rats. The rats were exposed to 12 hours of white light (1000 lx) and 12 hours of darkness for 10 days (control, 6 rats), 12 hours of blue light (1000 lx) and 12 hours of darkness for 10 days (long-term, 9 rats), and blue light (1000 lx) for 2 days (acute, 9 rats). (A) Control group (20×). Note: Dense network of melanopsin-positive dendrites. (B) Control group (40×). Multiple melanopsin-positive processes with varicosities are visible. (C) Long-term exposure group (20×). A wide-spread dendritic network of melanopsin-positive processes is visible. Note the smaller number of melanopsin-positive ipRGC somas. (D) Long-term exposure group (40×). Multiple melanopsin-positive varicosities are also visible here. Note: Two melanopsin-immunoreactive cells located in the ganglion cell layer (arrow) and in the inner nuclear layer (double arrow). (E) Acute exposure group (20×). Note: Levels of melanopsin expression differ widely in the ipRGC somas. Relative to the other groups, melanopsin immunoreactivity is decreased in the dendrites, and the melanopsin-positive varicosities on the nerve fibers are less prominent. (F) Acute exposure group (40×). Melanopsin is present mostly in ipRGC somas and proximal dendrites. Note: Lack of varicosities on these processes and decreased melanopsin immunoreactivity in outer stratifying dendrites (arrows). Samples were visualized with a confocal microscope (LSM700, Zeiss). (G) Circles indicate number of ipRGCs in a 2.560 mm2 area of one retina from one rat; horizontal lines show mean. (E) Dots indicate differences between groups with regard to mean counts of ipRGCs; error bars show 95% confidence intervals for the differences.

