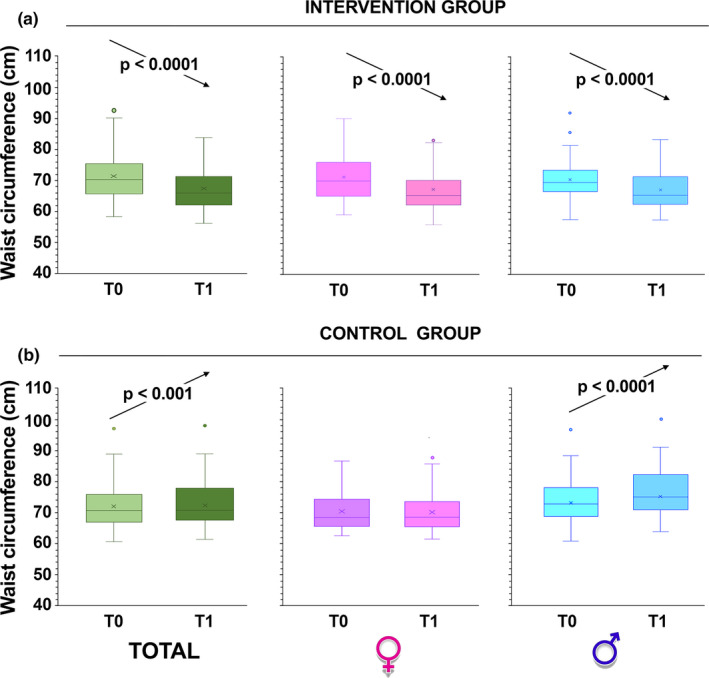
FIGURE 3.

Changes in waist circumference over time. Box and whiskers representation of waist circumference of intervention group (a) and control children (b), recorded at baseline (T0) and at 6 months from baseline (T1, at the completion of the intervention). The sample was also divided according to gender. In this representation, the central box covers the middle 50% of the data values, between the upper and lower quartiles. The bars extend out to the extremes, while the central line is at the median. Those values which are beyond 1.5 times the interquartile range beyond the central box are plotted as individual points. p‐values were obtained by Student's paired t‐test
