
FIGURE 5.
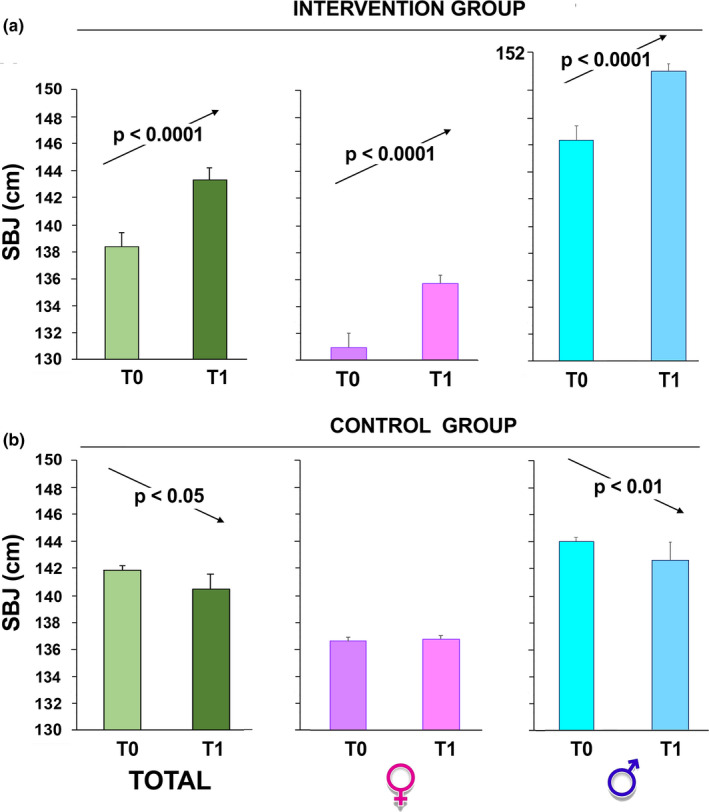
Standing broad jump test (SBJ) performance over time. The children, intervention group (a) and control group (b), were evaluated at T0 and 6 months after (T1, at the completion of the intervention). The sample was also divided according to gender. The data are presented as mean ± SD and significant differences between groups were evaluated by Student's paired t‐test