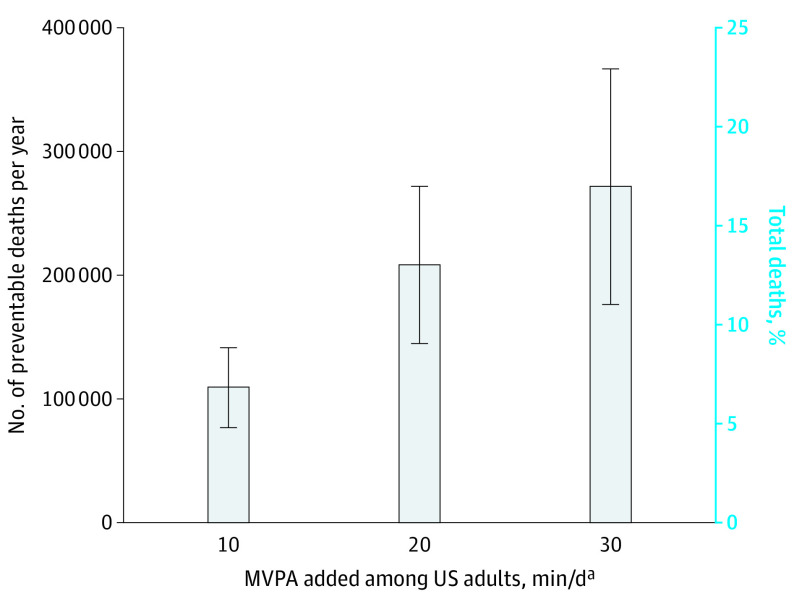
Figure. Number of Preventable Deaths and Equivalent Proportion of Total Deaths by Added Amount of MVPA Among US Adults Aged 40 to 85 Years or Older, 2003 to 2006 National Health and Nutrition Examination Survey.
Hazard ratios were estimated using Cox proportional hazard regression models and the proportional hazards assumption was confirmed for moderate-to-vigorous physical activity intensity (MVPA). Hazard ratios (95% CIs) were used to generate the population attributable fractions (PAFs). When calculating the PAFs, physical activity levels for participants identified as having frailty or needing special equipment to walk were held constant. Bars represent 95% CIs for both the estimated number of deaths and the proportion of total deaths. Hazard ratios and the estimated number of deaths per year were adjusted for age, sex, race and ethnicity, education level, body mass index, diet quality, alcohol consumption, smoking status, self-reported diabetes, heart disease, heart failure, stroke, cancer, chronic bronchitis, emphysema, mobility limitations, and general health. The number of deaths per year was computed using the 2003 annual mortality for US adults aged 40 to 84 years. Models included US population and study design weights to account for the complex survey. Sample weights also included poststratification adjustments from loss of observations attributable to missing accelerometry data, and all participants were eligible for mortality linkage through the National Death Index.
aTotal number of minutes per day recorded by the accelerometer that were at or above the cutpoint of 760 counts per minute4 (ie, MVPA).

