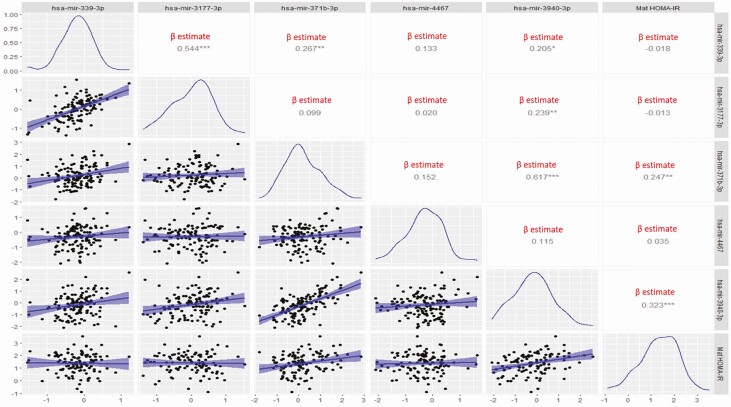
Figure 2.
Scatterplots displaying the simple linear regression between each of the miRNAs and maternal insulin resistance (HOMA-IR) in late pregnancy. The blue histograms show the normalized curves of each variable. In the right upper corner squares show the β estimate (significant β estimates marked with an *). * P ≤ 0.05; **P ≤ 0.01; ***P ≤ 0.001.

