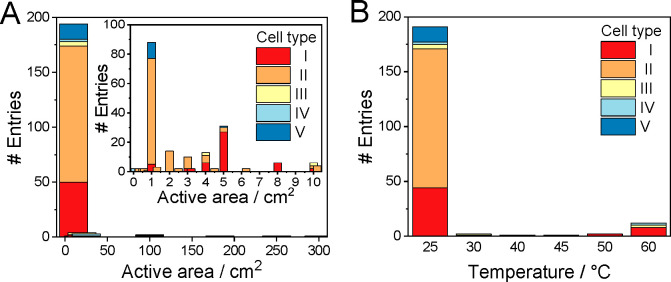
Figure 4.
Diagrams showing (A) the geometric area distribution of the electrolyzer cells used (data points were gathered from refs (7−13, 16−18, 29, 32, 34, 36−140, 145, and 146)) and (B) the applied cell types as a function of the applied reaction temperature (data points were gathered from refs (7−13, 16−18, 29, 32, 34, 36−140, and 145−147)).

