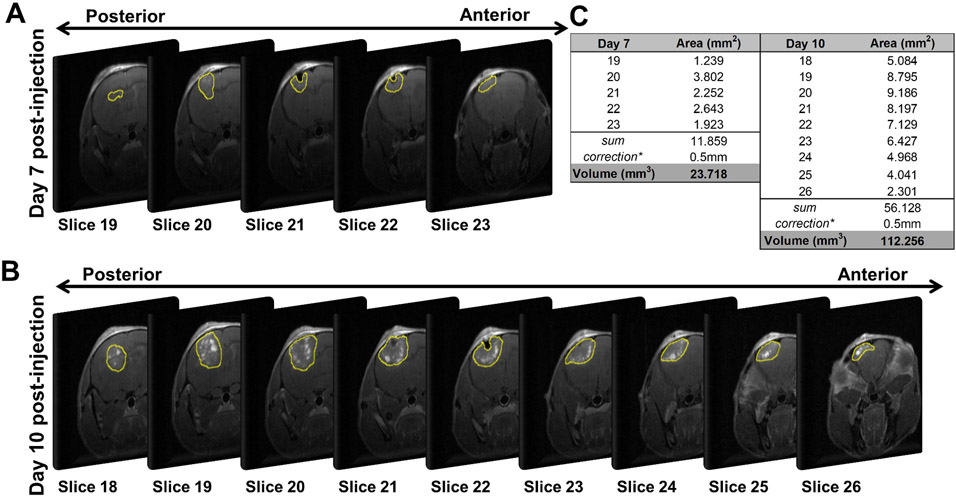
Figure 3: Example of tumor volume quantification for a single mouse over two time points post-injection.
Images of the slices containing tumor at (A) day 7 and (B) day 10 post-injection. Yellow denotes tumor area quantified in ImageJ. (C) Slice area and total volumetric quantification as determined in ImageJ (*=correction for slice thickness (0.5 mm)).

