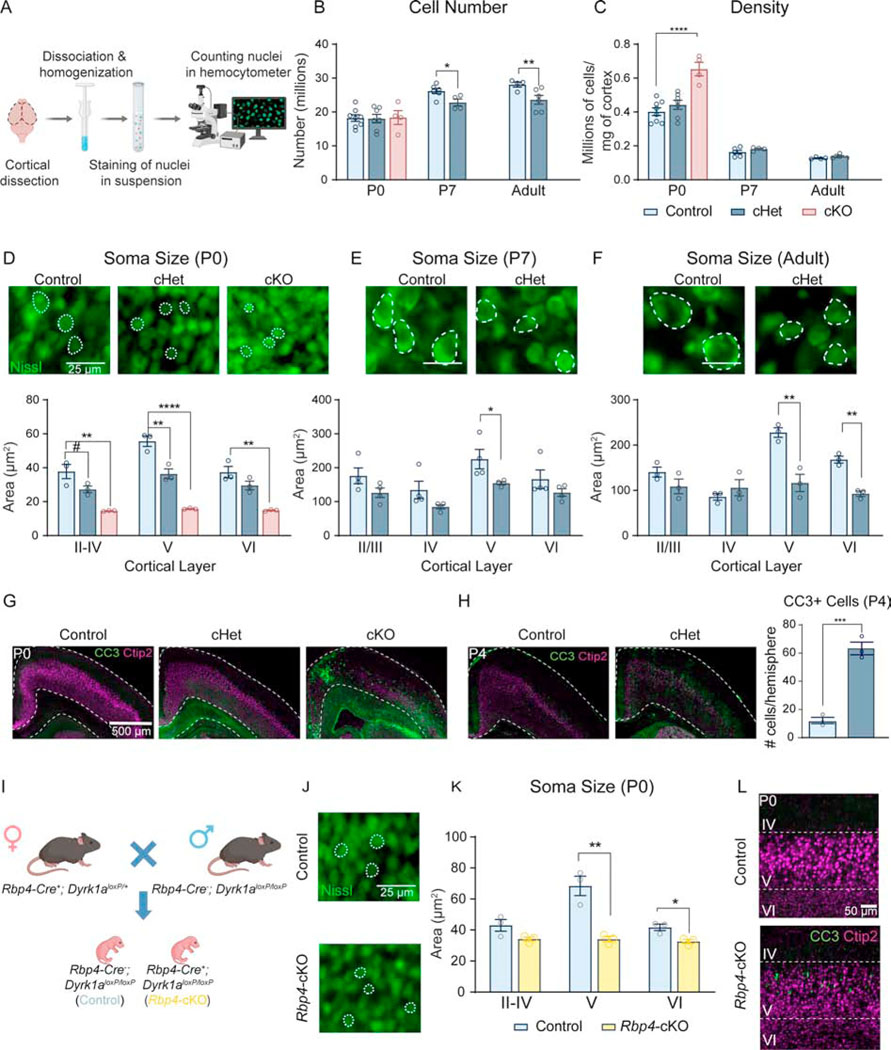
Figure 3: Microcephaly in conditional Dyrk1a mutants is driven by decreased cell size at birth and decreased cell number after birth.
(A) Schematic of isotropic fractionator protocol.
(B) At birth, P0 cHets and cKOs do not exhibit alterations in cell number in the cortex. At P7 and adulthood, cell number is significantly reduced relative to controls. P0 analyzed by one-way ANOVA with Tukey’s post hoc multiple comparisons tests (shown on graph; F2,16=.01390, P=.9862). P7 and adult timepoints analyzed by independent sample t-test (P7: t8=2.663, P=.028690; adult: t8=2.579, P=.032651).
(C) At P0, cortical cell density is significantly increased in cKOs and is normalized by P7 and through adulthood. P0 analyzed by one-way ANOVA with Tukey’s post hoc multiple comparisons tests (shown on graph; F2,16=18.31, P<.0001). P7 and adult timepoints analyzed by independent sample t-tests (P7: t8=1.345, P=.215528; adult: t8=1.942, P=.0881). For all ages, N=4–8/genotype.
(D) Representative images of Nissl-stained cell somas in layer V of somatosensory cortex at birth with quantification showing significant decreases in multiple layers of P0 cHet and cKO cortices. Analyzed by one-way ANOVA [I-IV (F2,6=18.83, P=.0026), V (F2,6=65.83, P<.0001), VI (F2,6=21.62 P=.0018)] with Tukey’s post hoc multiple comparisons tests.
(E) Representative Nissl-stained cell somas at P7 with quantification showing a significant decrease in layer V of somatosensory cortex in cHets [independent sample t-tests: II/III (t6=1.842, P=.114989), IV (t6=1.897, P=.106656), V (t6=2.462, P=.048976), VI (t6=1.328, P=.23571)].
(F) Representative images of Nissl-stained cell somas in layer V of somatosensory cortex in adult animals with quantification showing that somas in layers V and VI are significantly smaller in cHets [independent sample t-tests II/III (t4=1.612, P=.182235), IV (t4=1.045, P=.355062), V (t4=5.107, P=.006961), VI (t4=7.862, P=.001414)]. For all ages, N=3–4/genotype.
(G) Representative images of CC3 staining in the cortex at birth.
(H) Representative images of increased CC3 in the cortex at P4 with quantification of CC3+ cells per cortical hemisphere using immunohistochemistry. Analyzed by independent sample t-test (t4=10.21, P=.0005). N=3/genotype.
(I) Breeding scheme used to generate Rbp4-cre+; Dyrk1aloxP/loxP pups.
(J) Representative images of Nissl-stained cell somas in layer V of somatosensory cortex at birth in Rbp4-cKOs
(K) Quantification of soma size using Nissl-stained sections shows that Rbp4-cKOs exhibit decreased soma size in layer V of somatosensory cortex compared to controls [independent sample t-tests: II-IV (t4 =4.00343, P=.091760), V (t4=6.48343, P=.006136), VI (t4=2.46921, P=.021545)]. N=3/genotype.
(L) Representative images of CC3 staining in the cortex at birth shows that Rbp4-cKOs exhibit increased CC3+ apoptotic cells in layer V.
Results from post hoc and t-tests indicated on graphs. Error bars represent mean +/− SEM. *P<.05, **P<.01, ***P<.001, ****P<.0001.

