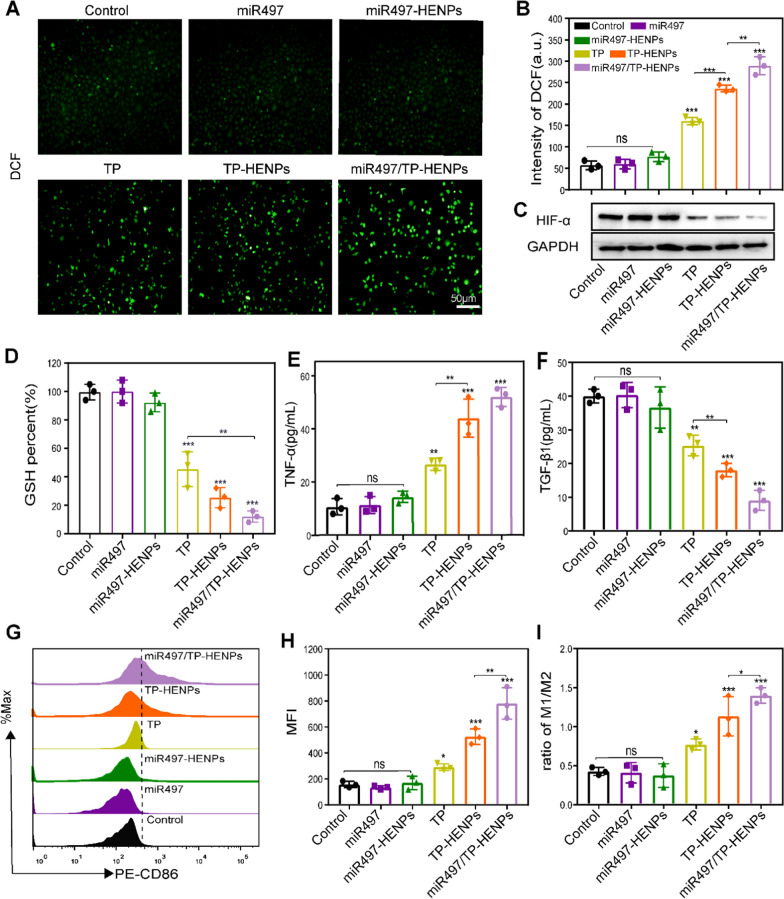
Fig. 5.
miR497/TP-HENPs boost intracellular ROS and induce M2 to M1 polarization of macrophages. A ROS in SKOV3-CDDP cells. Scale bar: 50 μm. B Quantitative analysis of ROS in SKOV3-CDDP cells by FCM. C Analysis of the expression of HIF-α using WB assay. D GSH quantity in SKOV3-CDDP cells. E, F Cell supernatant levels of TNF-α and TGF-β1 in different treatment groups of RAW264.7 macrophages. G, H FCM analysis of the expression of M1 macrophage markers (F4/80 + CD86 +) and quantitative analysis of the MFI of PE-CD86. I The ratio of M1/M2 subtype macrophages treated with different groups in vitro

