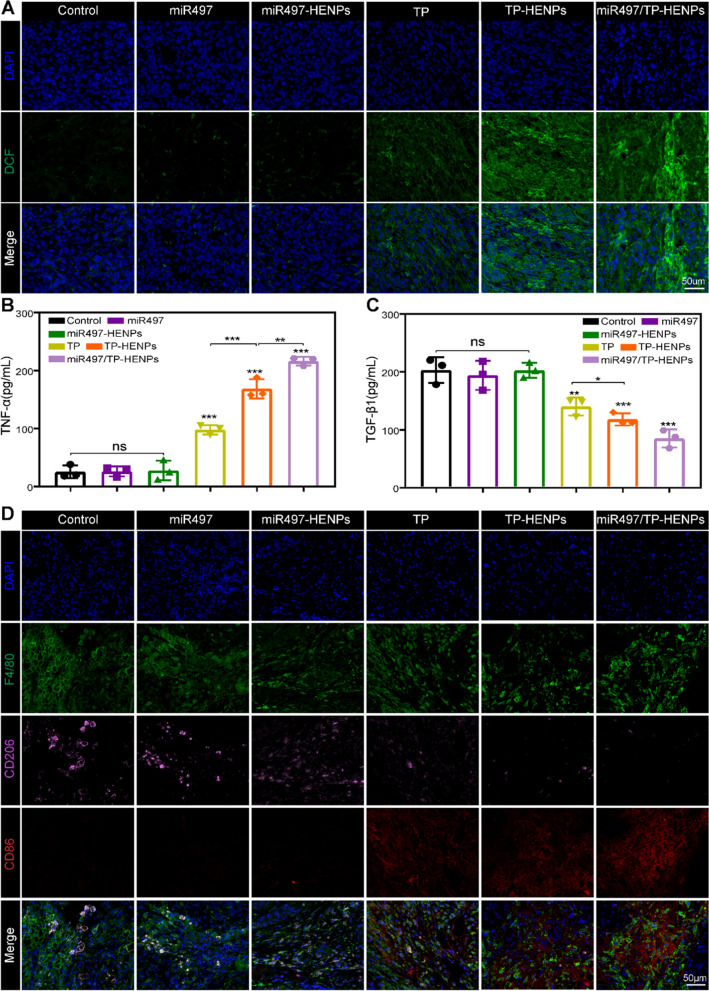
Fig. 7.
miR497/TP-HENPs induced ROS production in cisplatin-resistant OC and regulated macrophage polarization from M2 to M1 in vivo. A The ROS of tumor sections after treatments. Scale bar: 50 µm. B, C Serum levels of TNF-α and TGF-β1 in different treatment groups in vivo. One-way ANOVA was used to determine significant differences; *p < 0.05; **p < 0.01, ***p < 0.001, compared with the indicated groups. D Immunofluorescence staining images of different macrophage markers (M1, F4/80 + CD86 + and M2, F4/80 + CD206 +) in tumor tissue sections. Scale bar: 50 µm

