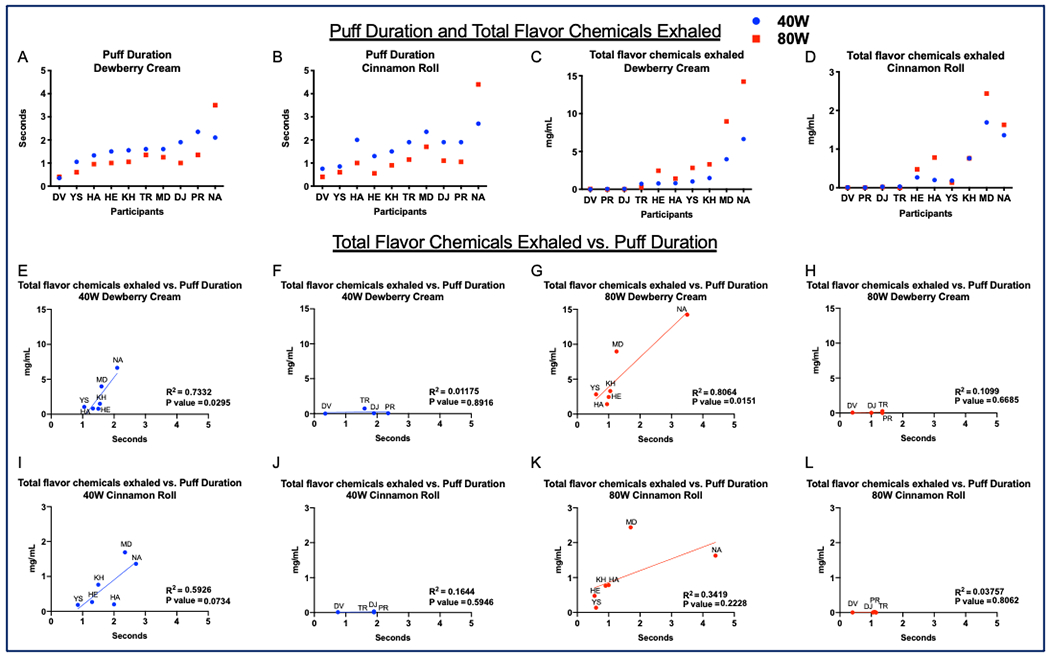
Figure 3: Participant topography: puff duration and total flavor chemicals exhaled.

A and B show each participant’s puff duration for Dewberry Cream and Cinnamon Roll. C and D show the concentration of the total flavor chemicals exhaled (mg/ml). E through L show the relationship between the total flavor chemicals exhaled and puff duration. Mouth inhalers are shown in E, G, I, and K, while lung inhalers are shown in F, H, J, and L.
