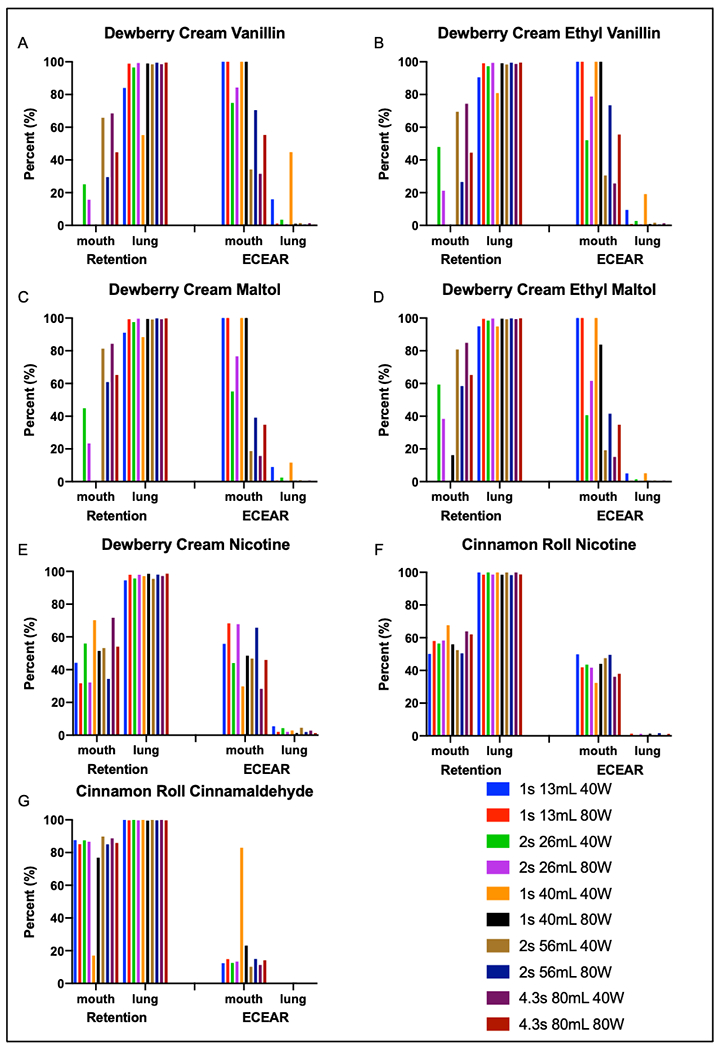
Figure 5: Retention and contribution to ECEAR of major flavor chemicals by participants under several EC settings and conditions.

Each participant’s exhaled results were averaged for each topography to determine possible retention. Contribution to ECEAR was then calculated and averaged based on the amount retained. The y axis shows the percent retention or percent ECEAR while the x axis shows the participants averaged and separated by method of inhalation. EC settings, puff duration and puff volume are color coated.
