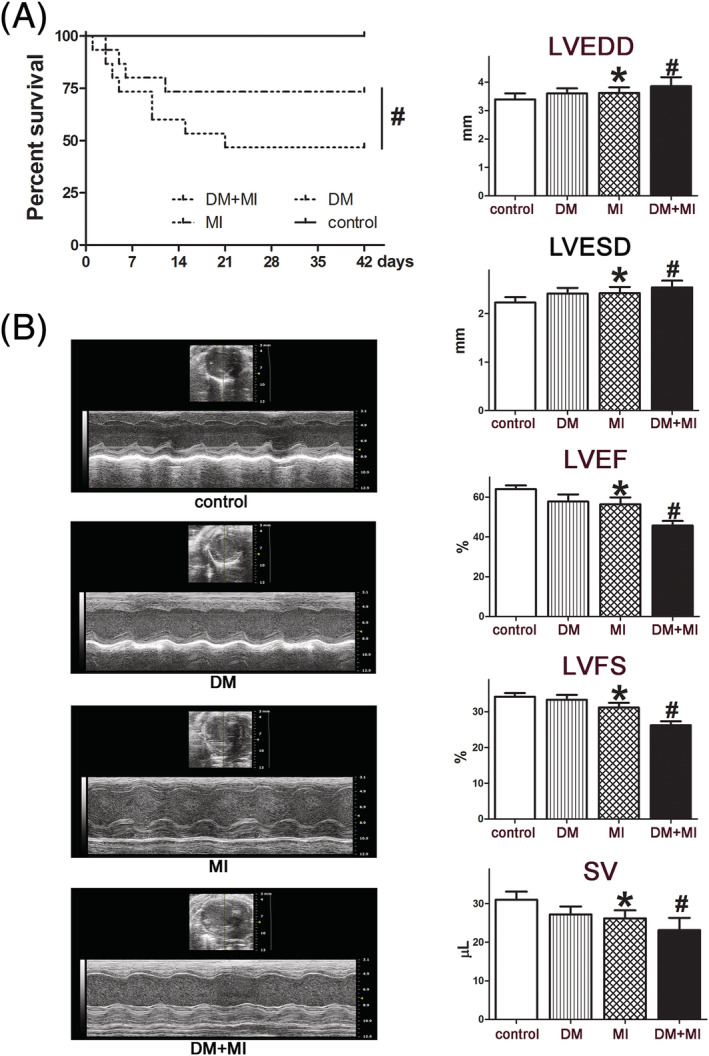
Figure 1.

DM increased mortality and deteriorated cardiac dysfunction after MI. (A) Kaplan–Meier survival curves after MI for control and DM mice 42 days after MI. (B) Representative M‐mode images and quantitative analysis of cardiac parameters, including LVEDV, LVESV, LVEF, LVFS, and SV at 42 days after MI. Data are expressed as means ± SEM. # P < 0.05 DM + MI vs. MI; *P < 0.05 MI vs. controls. DM, diabetes mellitus; LVEDV, left ventricular end‐diastolic volume; LVEF, left ventricular ejection fraction; LVESV, left ventricular end‐systolic volume; LVFS, left ventricular fractional shortening; MI, myocardial infarction; SV, systolic volume.
