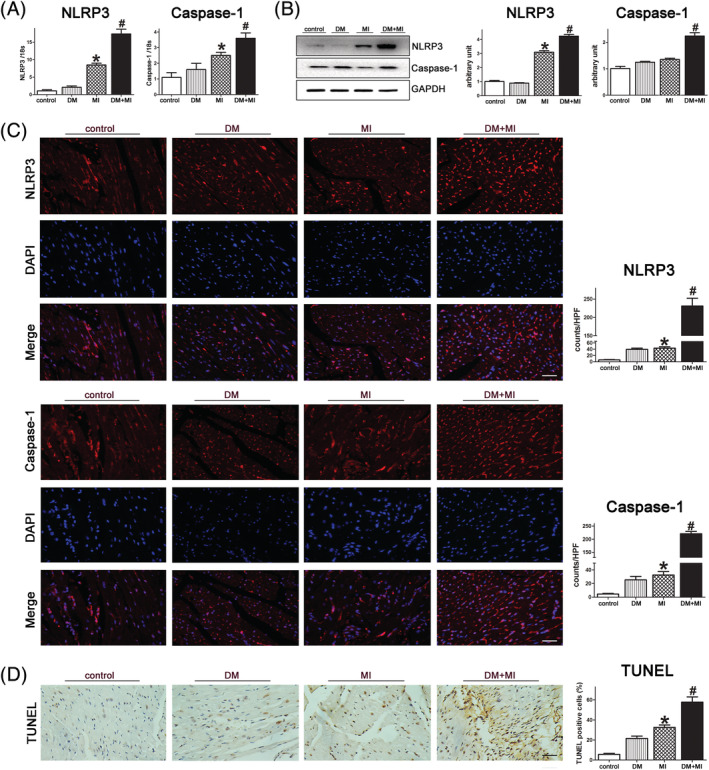
Figure 4.

DM activated the myocardial NLRP3 inflammasome and caspase‐1 in mice after MI. (A & B) The mRNA and protein levels of NLRP3 and cleaved caspase‐1 were assessed by qPCR and western blotting analysis. Graph right shows densitometric quantification. (C) Representative image of immunofluorescence assays of NLRP3 and cleaved caspase‐1 in LV tissue sections from control and DM hearts after MI. DAPI nuclear staining in blue (scale bar = 50 μm). (D) Representative images of TUNEL‐positive cells in the myocardium from DM and the control group. Original magnification ×400 (scale bar = 50 mm). # P < 0.05 DM + MI vs. MI; *P < 0.05 MI vs. controls. DM, diabetes mellitus; MI, myocardial infarction.
