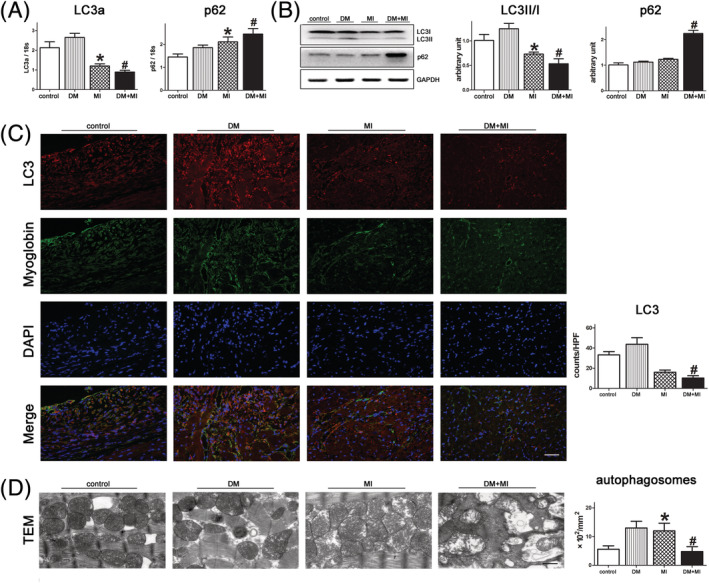
Figure 5.

DM impaired autophagy in the myocardium of post‐infarct mice. (A) Expression levels of genes critical in autophagy in myocardial homogenates from peri‐infarct regions of the left ventricle after MI. (B) Western blot analysis of the autophagy proteins LC3 and p62 in myocardial homogenates from peri‐infarct regions of the left ventricle after MI. (C) Representative image of immunofluorescence assays of LC3 dots in left ventricle tissue sections of hearts from different groups; red, LC3; blue, DAPI‐stained nuclei; green, myoglobin‐positive cardiomyocytes (scale bar = 50 μm). (D) Electron micrographs show more autophagic vacuole formation in cardiomyocytes of MI mice in the presence and absence of DM. Quantification of autophagy by measuring the average number of autophagic vacuoles per 100 fields in electron microscope images (scale bars = 500 nm). # P < 0.05 DM + MI vs. MI; *P < 0.005 MI vs. controls. DM, diabetes mellitus; MI, myocardial infarction; TEM, transmission electron microscopy.
