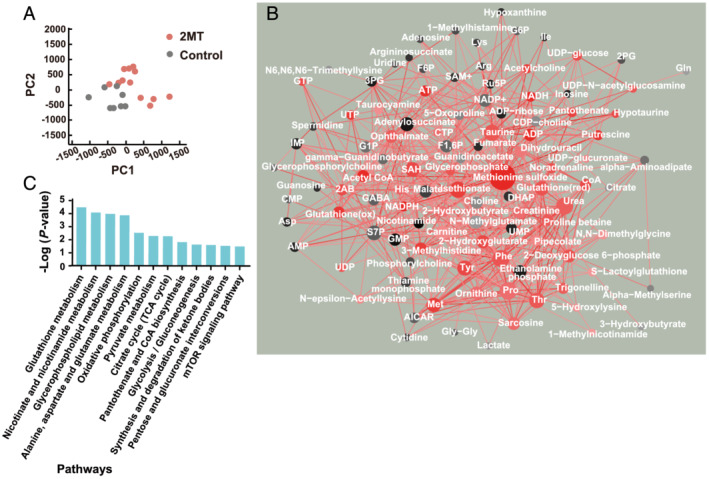
Figure 4.

Network analysis reveals the association of discriminative metabolites following 2MT administration. (A) Principal component analysis of metabolome data after a subcutaneous injection of 2MT (50 mg/kg) or saline. Red nodes indicate 2MT; black nodes indicate control. (B) PC‐corr network between metabolites constructed with a cutoff of 0.6. Perturbed metabolites are depicted according to the size and colour shading of nodes. Black and red colours indicate up‐regulated perturbation in control and 2MT, respectively. (C) Enrichment analysis conducted by MBROLE. The top 12 pathways are ranked by Benjamini‐adjusted P values and scaled according to the function‐log10 (P value). 2MT, 2‐methyl‐2‐thiazoline; PC1, first principal component; PC2, second principal component.
