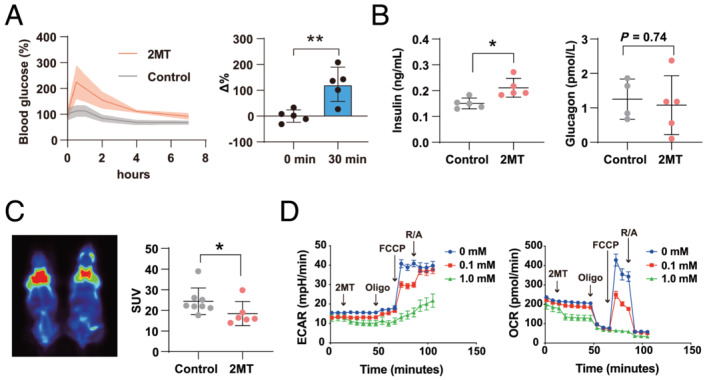
Figure 6.

2MT modulates glucose metabolism and mitochondrial respiration. (A) Blood glucose concentration after a subcutaneous injection of 2MT (50 mg/kg) or saline (left graph) and changes (right graph) 30 min after injection (n = 5 for each group). (B) Serum insulin levels (left graph) (n = 5 for each group) and glucagon levels (right graph) (control n = 4, 2MT n = 5) 1 h after a subcutaneous injection of 2MT (50 mg/kg) or saline. (C) BAT activity was detected by PET/CT image after a subcutaneous injection of 2MT (50 mg/kg) or saline (left) and quantification of SUV (right) (control n = 8, 2MT n = 6). (D) Representative plot of ECAR (left graph) and OCR (right graph) measured in H9C2 cells following treatment with 2MT (0, 0.1 or 1 mM) (n = 10 for each group). Sequential addition of oligomycin (Oligo), FCCP (carbonyl cyanide p‐trifluoromethoxyphenylhydrazone), and rotenone/antimycin A (R/A) is indicated in the graph. *P < 0.05, **P < 0.01; two‐tailed Student t test. All values are mean ± standard deviation (SD). Each dot represents one mouse. 2MT, 2‐methyl‐2‐thiazoline; BAT, brown adipose tissue; PET/CT, positron emission tomography/computed tomography; SUV, standardized uptake value; ECAR, extracellular acidification rate; OCR, oxygen consumption rate.
