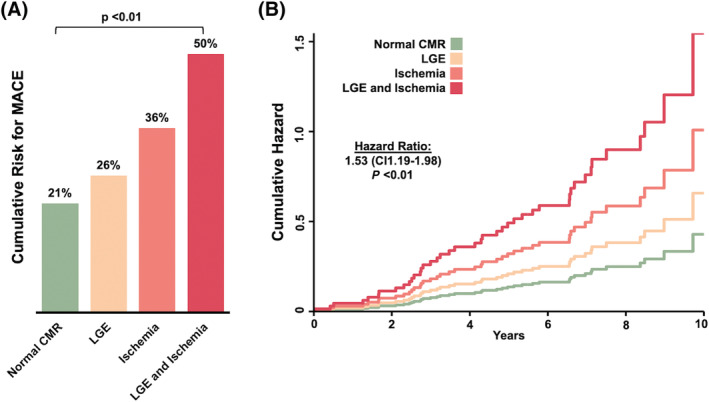
Figure 3.

(A) Proportion of cumulative incidence of MACE in cohorts stratified by CMR result: without ischaemia and late gadolinium enhancement (LGE), without ischaemia and with LGE, with ischaemia and without LGE, and with both ischaemia and LGE. The P‐value for trend is given, assuming a linear trend for odds ratio (OR: 1.5; confidence interval 1.1–2.1). (B) Cumulative hazard for MACE in cohorts stratified by CMR result. The hazard ratio is calculated using Cox regression analysis.
