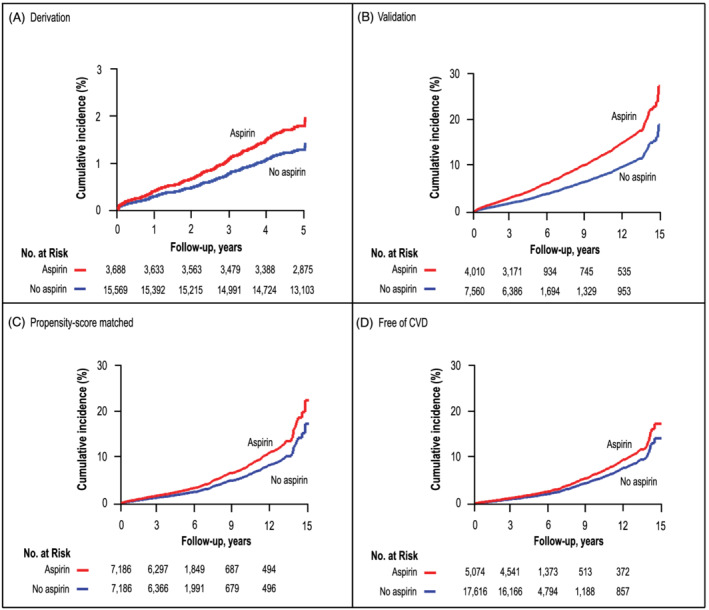
FIGURE 1.

Panels (A), (B), (C), and (D) show study, sex‐standardized, and age‐standardized cumulative incidence of heart failure in participants using aspirin use (red line) and non‐using aspirin (blue line). The tabulated numbers represent the participants at risk with intervals in years. P‐value is for the significance of the difference between aspirin use and non‐use.
