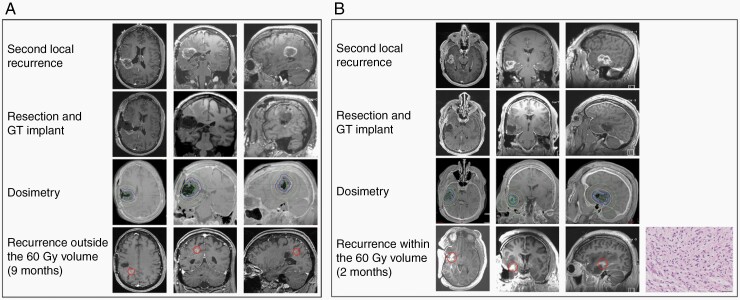
Figure 1.
Illustrative examples of GammaTile® (GT) dosimetry and local control. (A) Patient 1 developed new contrast enhancement outside of the HR-CTV (See Methods). Preoperative axial, coronal, and sagittal MR postgadolinium T1 images (top row) and corresponding postoperative images (second row) are shown. GT dosimetry is shown on the third row. The green line indicates the HR-CTV. Axial, coronal, and sagittal MR postgadolinium T1 images at the time of recurrence are shown in the fourth row. (B) Patient 13 developed new contrast enhancement within the HR-CTV. The arrangement of images is described in (A). Hematoxylin and eosin (H&E) staining of the clinical specimen derived from resection of the contrast-enhancing lesion is shown in the rightmost panel on the fourth row. Pathology review of the sample revealed the presence of active tumor, indicating tumor recurrence.

