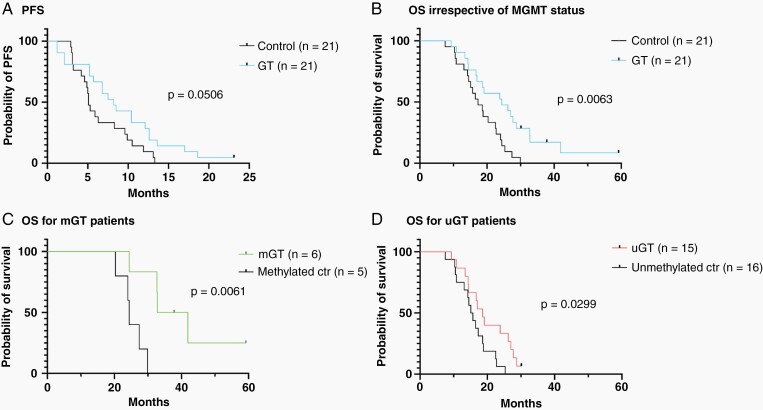
Figure 4.
PFS and OS between the GT-treated and a “control” cohort who underwent re-resection without GT. Shown are Kaplan-Meier analysis for (A) PFS for the control and GT-treated cohorts without stratification by MGMT promoter methylation status. (B) OS for the control and GT-treated cohorts. (C) OS for the control and GT-treated MGMTm (mGT) glioblastoma patients. (D) OS for the control and GT-treated MGMTu (uGT) glioblastoma patients.

