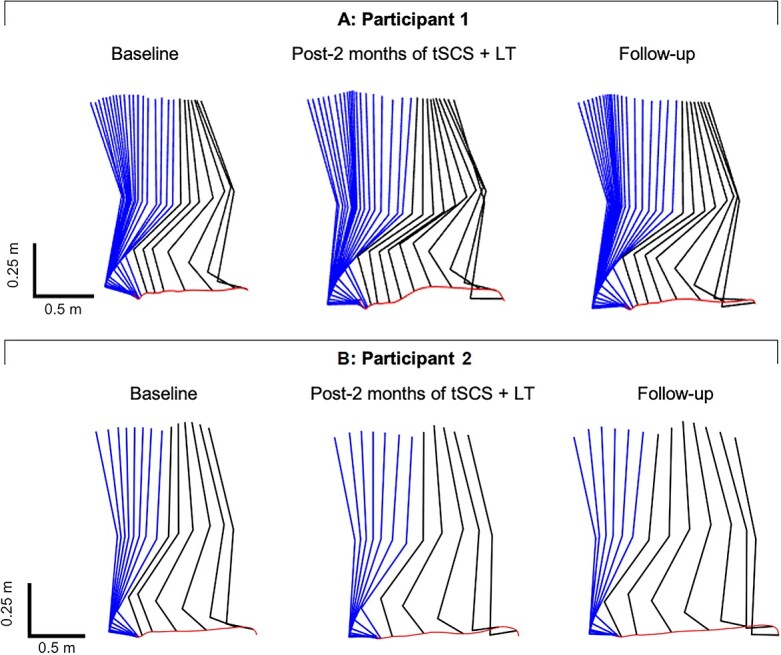
Figure 4.

Comparisons of right lower extremity stepping patterns at baseline, after the transcutaneous spinal cord stimulation phase, and in follow-up. Average right lower extremity movements during stance (blue) and swing (black) together with successive trajectories per 0.05 second of the joint endpoint. The red line indicates toe trajectory. A: Participant 1 demonstrated improved step length after the transcutaneous spinal cord stimulation and maintained the improvement throughout follow-up. B: Participant 2 improved step length after transcutaneous spinal cord stimulation phase and further improved during follow-up. LT = locomotor training; tSCS = transcutaneous spinal cord stimulation. The foot length appears to change due to rotation not captured in this sagittal plane view.
