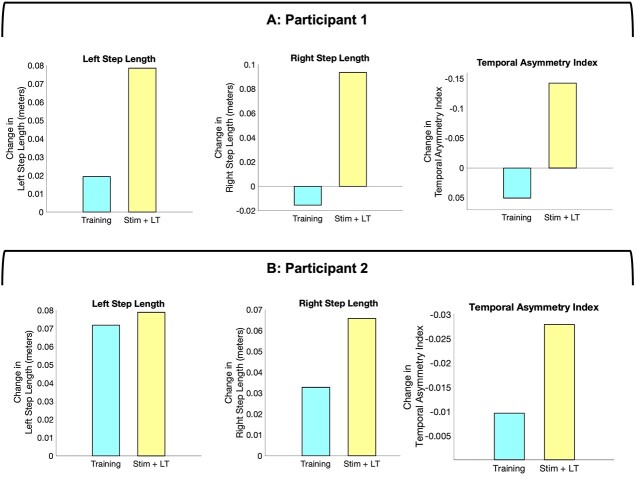
Figure 5.
Comparisons of spatiotemporal changes following locomotor training alone and following transcutaneous spinal cord stimulation combined with training (Stim + LT). Changes in spatiotemporal characteristics during each phase of the intervention. The changes were obtained by calculating the cumulative differences of mean values across phases. Blue bars show the total change during the locomotor training alone phase. Yellow bars show the total change during the transcutaneous spinal cord stimulation phase. The left and middle figures show right step length and left step length, respectively, in Participant 1 (A) and Participant 2 (B). The right figures show temporal asymmetry indices. The values of the y-axis are reversed as a negative value indicates improved interlimb coordination. Both participants improved step length and temporal interlimb coordination during the transcutaneous spinal cord stimulation. LT = locomotor training; Stim = transcutaneous spinal cord stimulation.

