
Figure 3.
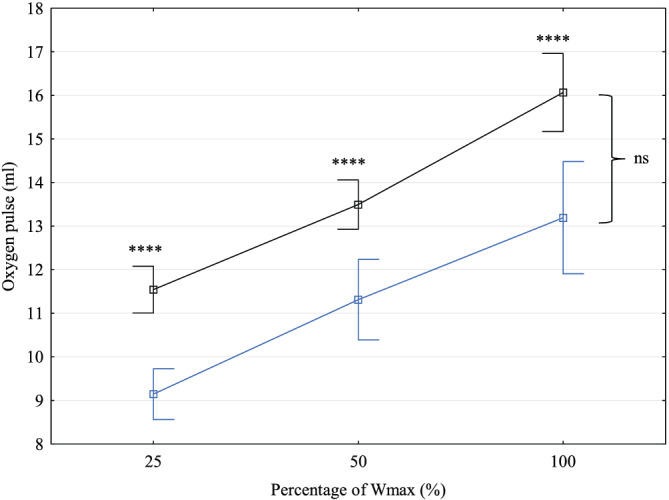
Oxygen pulse increase during exercise in men with total cavopulmonary connection (blue) compared to healthy controls (black). ns, non‐significant; Wmax, maximal power output in watts. ****P < 0.00001.
Official websites use .gov
A
.gov website belongs to an official
government organization in the United States.
Secure .gov websites use HTTPS
A lock (
) or https:// means you've safely
connected to the .gov website. Share sensitive
information only on official, secure websites.
Oxygen pulse increase during exercise in men with total cavopulmonary connection (blue) compared to healthy controls (black). ns, non‐significant; Wmax, maximal power output in watts. ****P < 0.00001.