
Figure 3.
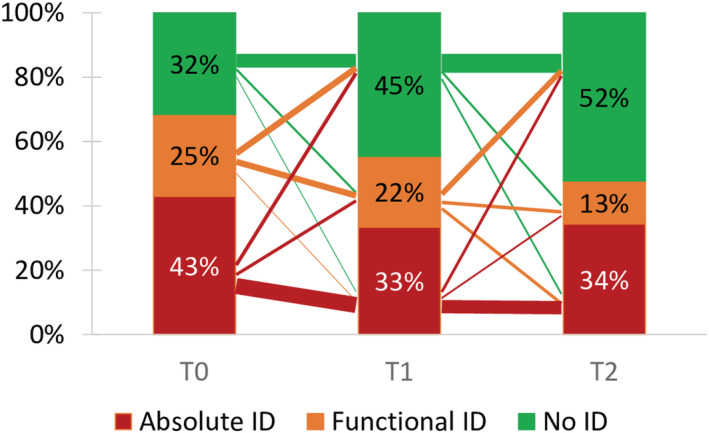
Iron deficiency (ID) at the different time points and variability between groups. Width of lines between groups indicates number of patients (1 pt = 10 patients).
Official websites use .gov
A
.gov website belongs to an official
government organization in the United States.
Secure .gov websites use HTTPS
A lock (
) or https:// means you've safely
connected to the .gov website. Share sensitive
information only on official, secure websites.
Iron deficiency (ID) at the different time points and variability between groups. Width of lines between groups indicates number of patients (1 pt = 10 patients).