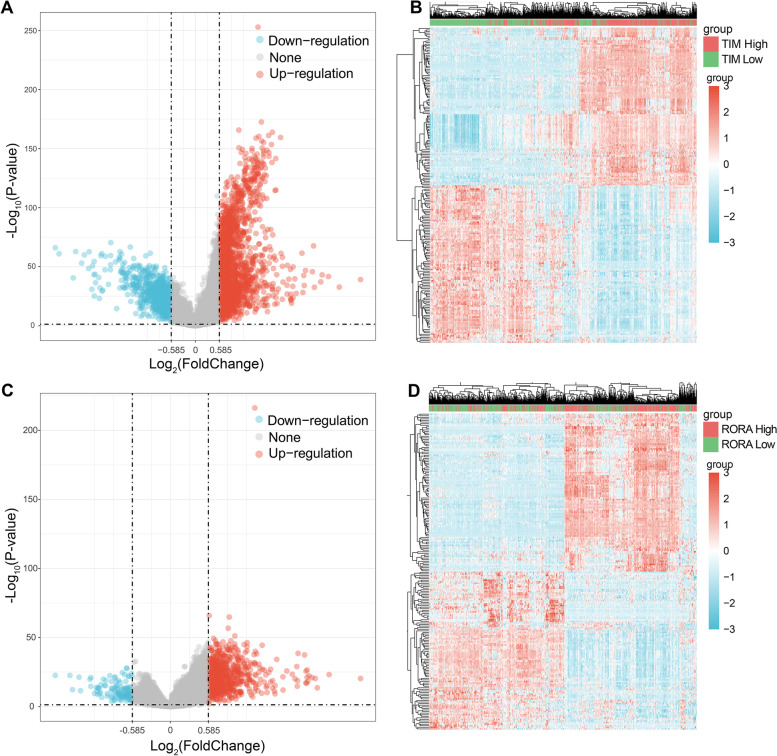
Fig. 4.
Identification of genes corelated to TIMELESS and RORA in NSCLC samples. Volcano plots were constructed using fold change and adjusted P-value to probe the genes significantly correlated to TIMELESS (A) and RORA (C) expression level. The red point in the plot represents the over-expressed mRNAs and the blue point indicates the down-expressed mRNAs with statistical significance. The hierarchical clustering analysis of mRNAs, which were significantly differentially expressed between high and low expression of TIMELESS (B) as well as RORA (D). Fold change > 1.5 and P < 0.05 were considered statistically significant

