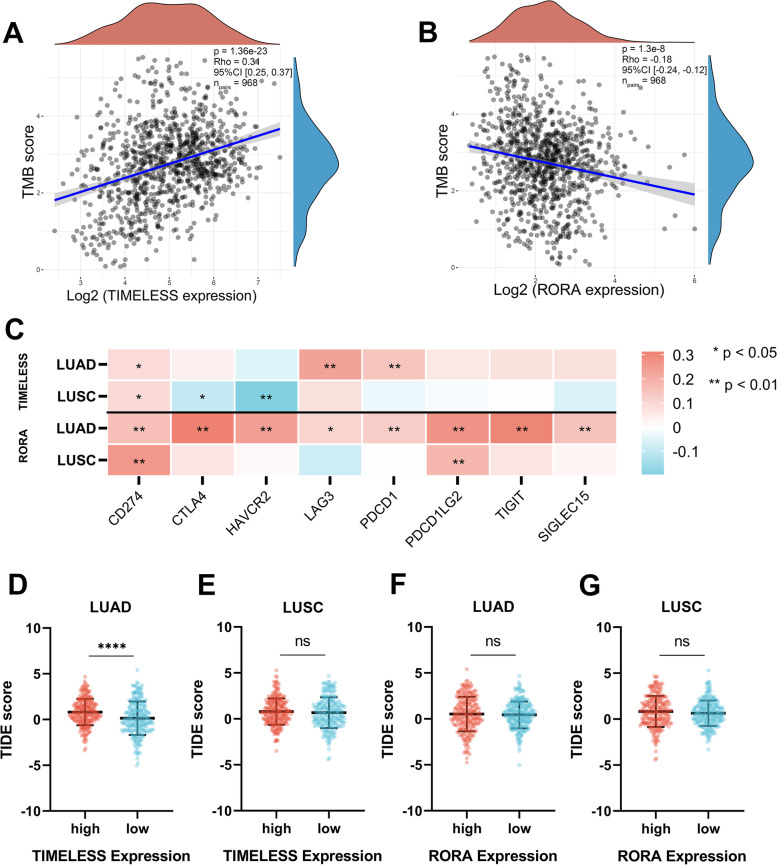
Fig. 8.
Correlation of TIMELESS and RORA expression level with TMB and immune checkpoint in NSCLC samples. Correlation analysis of TIMELESS (A) and RORA (B) expression with TMB. The horizontal axis in the figure represents the expression distribution of the gene, and the ordinate is the expression distribution of the TMB score. The density curve (blue) on the right represents the distribution trend of the TMB score, and the upper density curve (brown) represents the distribution trend of the gene. C Heatmap of the correlation of TIMELESS and RORA with immune checkpoint-related genes in LUAD and LUSC samples. Red means positive correlation and blue means negative correlation. D-G The TIDE score of NSCLC patients with different TIMELESS or RORA expression. *P < 0.05, **P < 0.01, ****P < 0.0001

