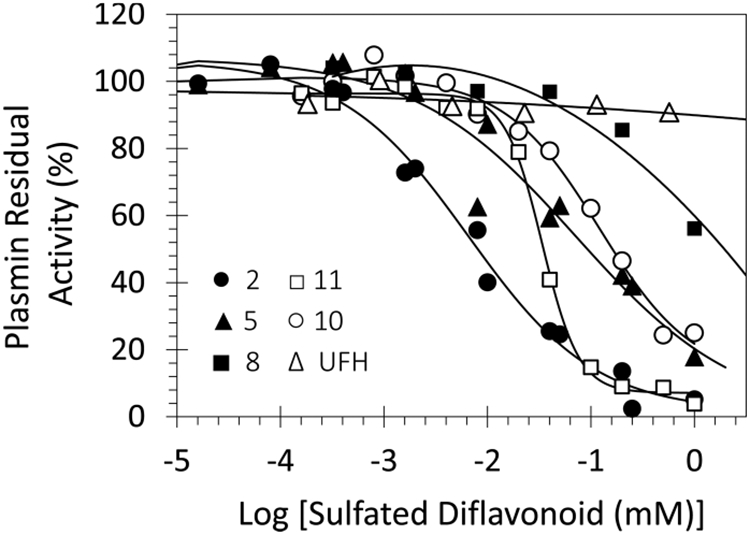
Figure 2.

Representative profiles of direct inhibition of human plasmin by sulfated NSGMs and UFH. The inhibition of plasmin was measured spectrophotometrically through a chromogenic substrate hydrolysis assay at pH 7.4 and 37 °C. Solid lines represent the sigmoidal fits to the data to obtain IC50, HS, YM, and Y0 using eq 1, as described in the Experimental Part.
