
Table 1.
In Vitro Inhibition of Human Plasmin by NSGMsa
| ||||||
|---|---|---|---|---|---|---|
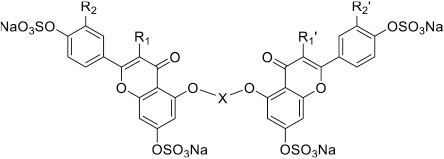
| Inhibitor | R1/R1` | R2/R2` | X | IC50 (μM) | HS | Δ Y (%) |
| 1 | OSO3Na | OSO3Na |
|
76 ± 12b | 1.0 ± 0.2 | 72 ± 9 |
| 2 | OSO3Na | OSO3Na |
|
6.3 ± 0.4 | 0.7 ± 0.1 | 93 ± 4 |
| 3 | OSO3Na | OSO3Na |
|
37 ± 7 | 0.8 ± 0.2 | 80 ± 11 |
| 4 | OSO3Na | OSO3Na |
|
6.5 ± 0.7 | 0.7 ± 0.1 | 104 ± 7 |
| 5 | OSO3Na | OSO3Na |
|
73 ± 11 | 0.6 ± 0.1 | 107 ± 7 |
| 6 | OSO3Na | OSO3Na |
|
231 ± 27 | 0.8 ± 0.2 | 90 ± 5 |
| 7 | H | H |
|
71 ± 2 | 2.4 ± 0.3 | 79 ± 3 |
| 8 | H | H |
|
>1000 | ND c | ND |
| 9 | H | H |
|
282 ± 17 | 1.8 ± 0.3 | 90 ± 8 |
| 10 | H | H |
|
121 ± 18 | 0.9 ± 0.2 | 90 ± 11 |
| 11 | H | H |
|
34 ± 1 | 2.4 ± 0.3 | 89 ± 2 |
| 12 | H | H |
|
47 ± 2 | 1.1 ± 0.1 | 79 ± 3 |
| 13 | H | H |
|
20 ± 1 | 2.0 ± 0.1 | 94 ± 2 |
| 14 | H | H |
|
34 ± 2 | 2.3 ± 0.5 | 86 ± 4 |
| 15 | H | H |
|
42 ± 3 | 1.2 ± 0.2 | 63 ± 4 |
| 16 | H/OSO3Na | H/OSO3Na |
|
14 ± 1 | 0.9 ± 0.1 | 109 ± 6 |
a
The IC50, HS, and ΔY values were obtained following nonlinear regression analysis of direct inhibition of human plasmin in appropriate Tris-HCl buffers of pH 7.4 at 37 °C. Inhibition was monitored spectrophotometrically. See Experimental Part for details.
b
Errors represent ±1 SE.
c
Not determined.