Figure 2.

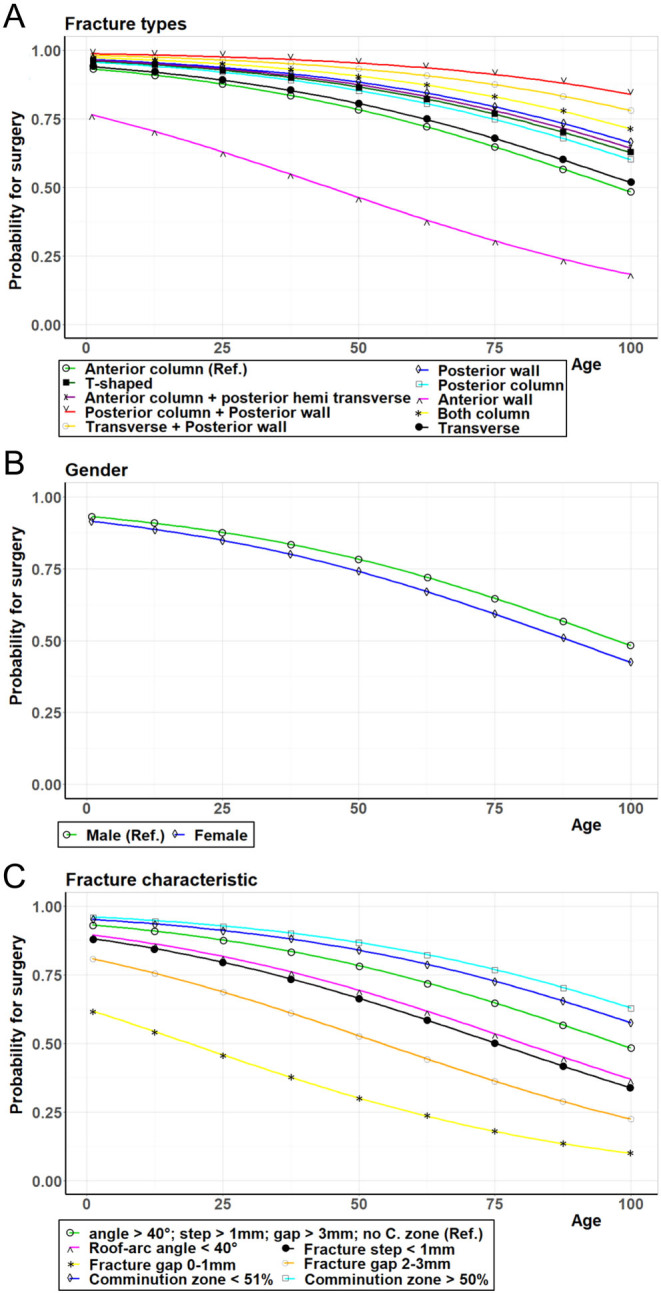
Probability for surgical intervention. The modeled probability for surgical intervention depending on the age is shown. (A) for the different fracture types; (B) for the genders, and (C) for different fracture characteristics.

Probability for surgical intervention. The modeled probability for surgical intervention depending on the age is shown. (A) for the different fracture types; (B) for the genders, and (C) for different fracture characteristics.