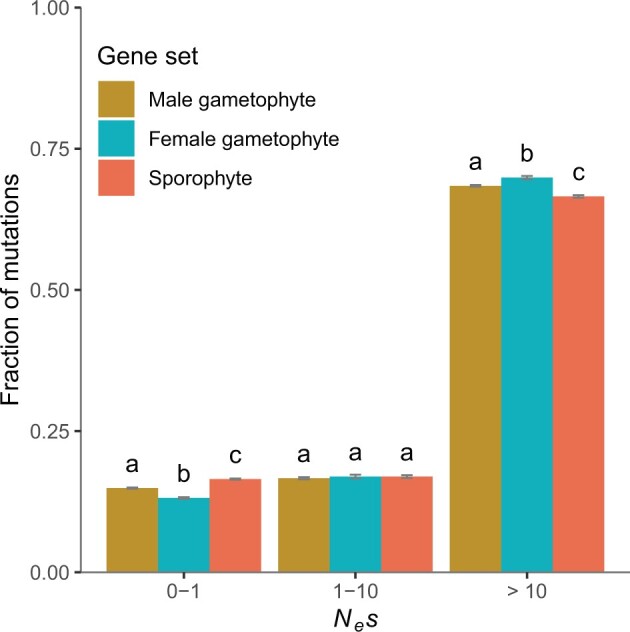
Fig. 1.

Comparison of DFE estimates for genes expressed in the male gametophyte (n = 12,398), the female gametophyte (n = 10,893), and sporophytic tissues (n = 10,000, random sample) for the outcrossing population Gre2. Error bars represent the bootstrap standard error (200 replicates). Different letters denote statistically significant differences between gene set categories.
