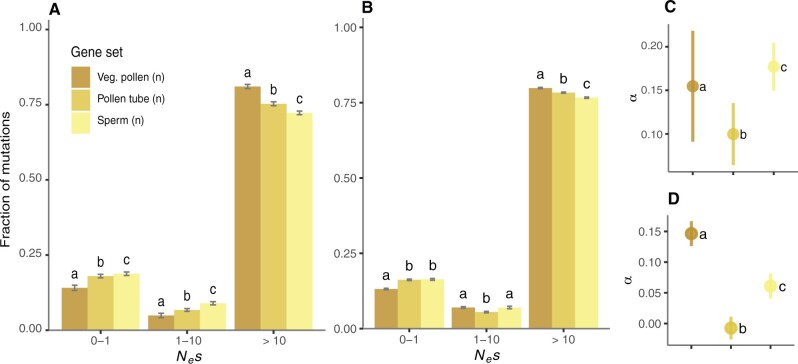
Fig. 4.
Comparison of the distribution of negative fitness effects (DFE) (A, B) and the proportion of adaptive substitutions (α) (C, D) after controlling for expression variables. (A, C) Control for expression specificity: vegetative pollen (n = 144), pollen tubes (n = 309), and sperm cells (n = 260). (B, D) Control for transcript abundance: vegetative pollen (n = 1,552), pollen tubes (n = 2,387), and sperm (n = 3,218). Error bars represent the bootstrap standard error (200 replicates). Different letters denote statistically significant differences between gene sets.

