
Figure 2.
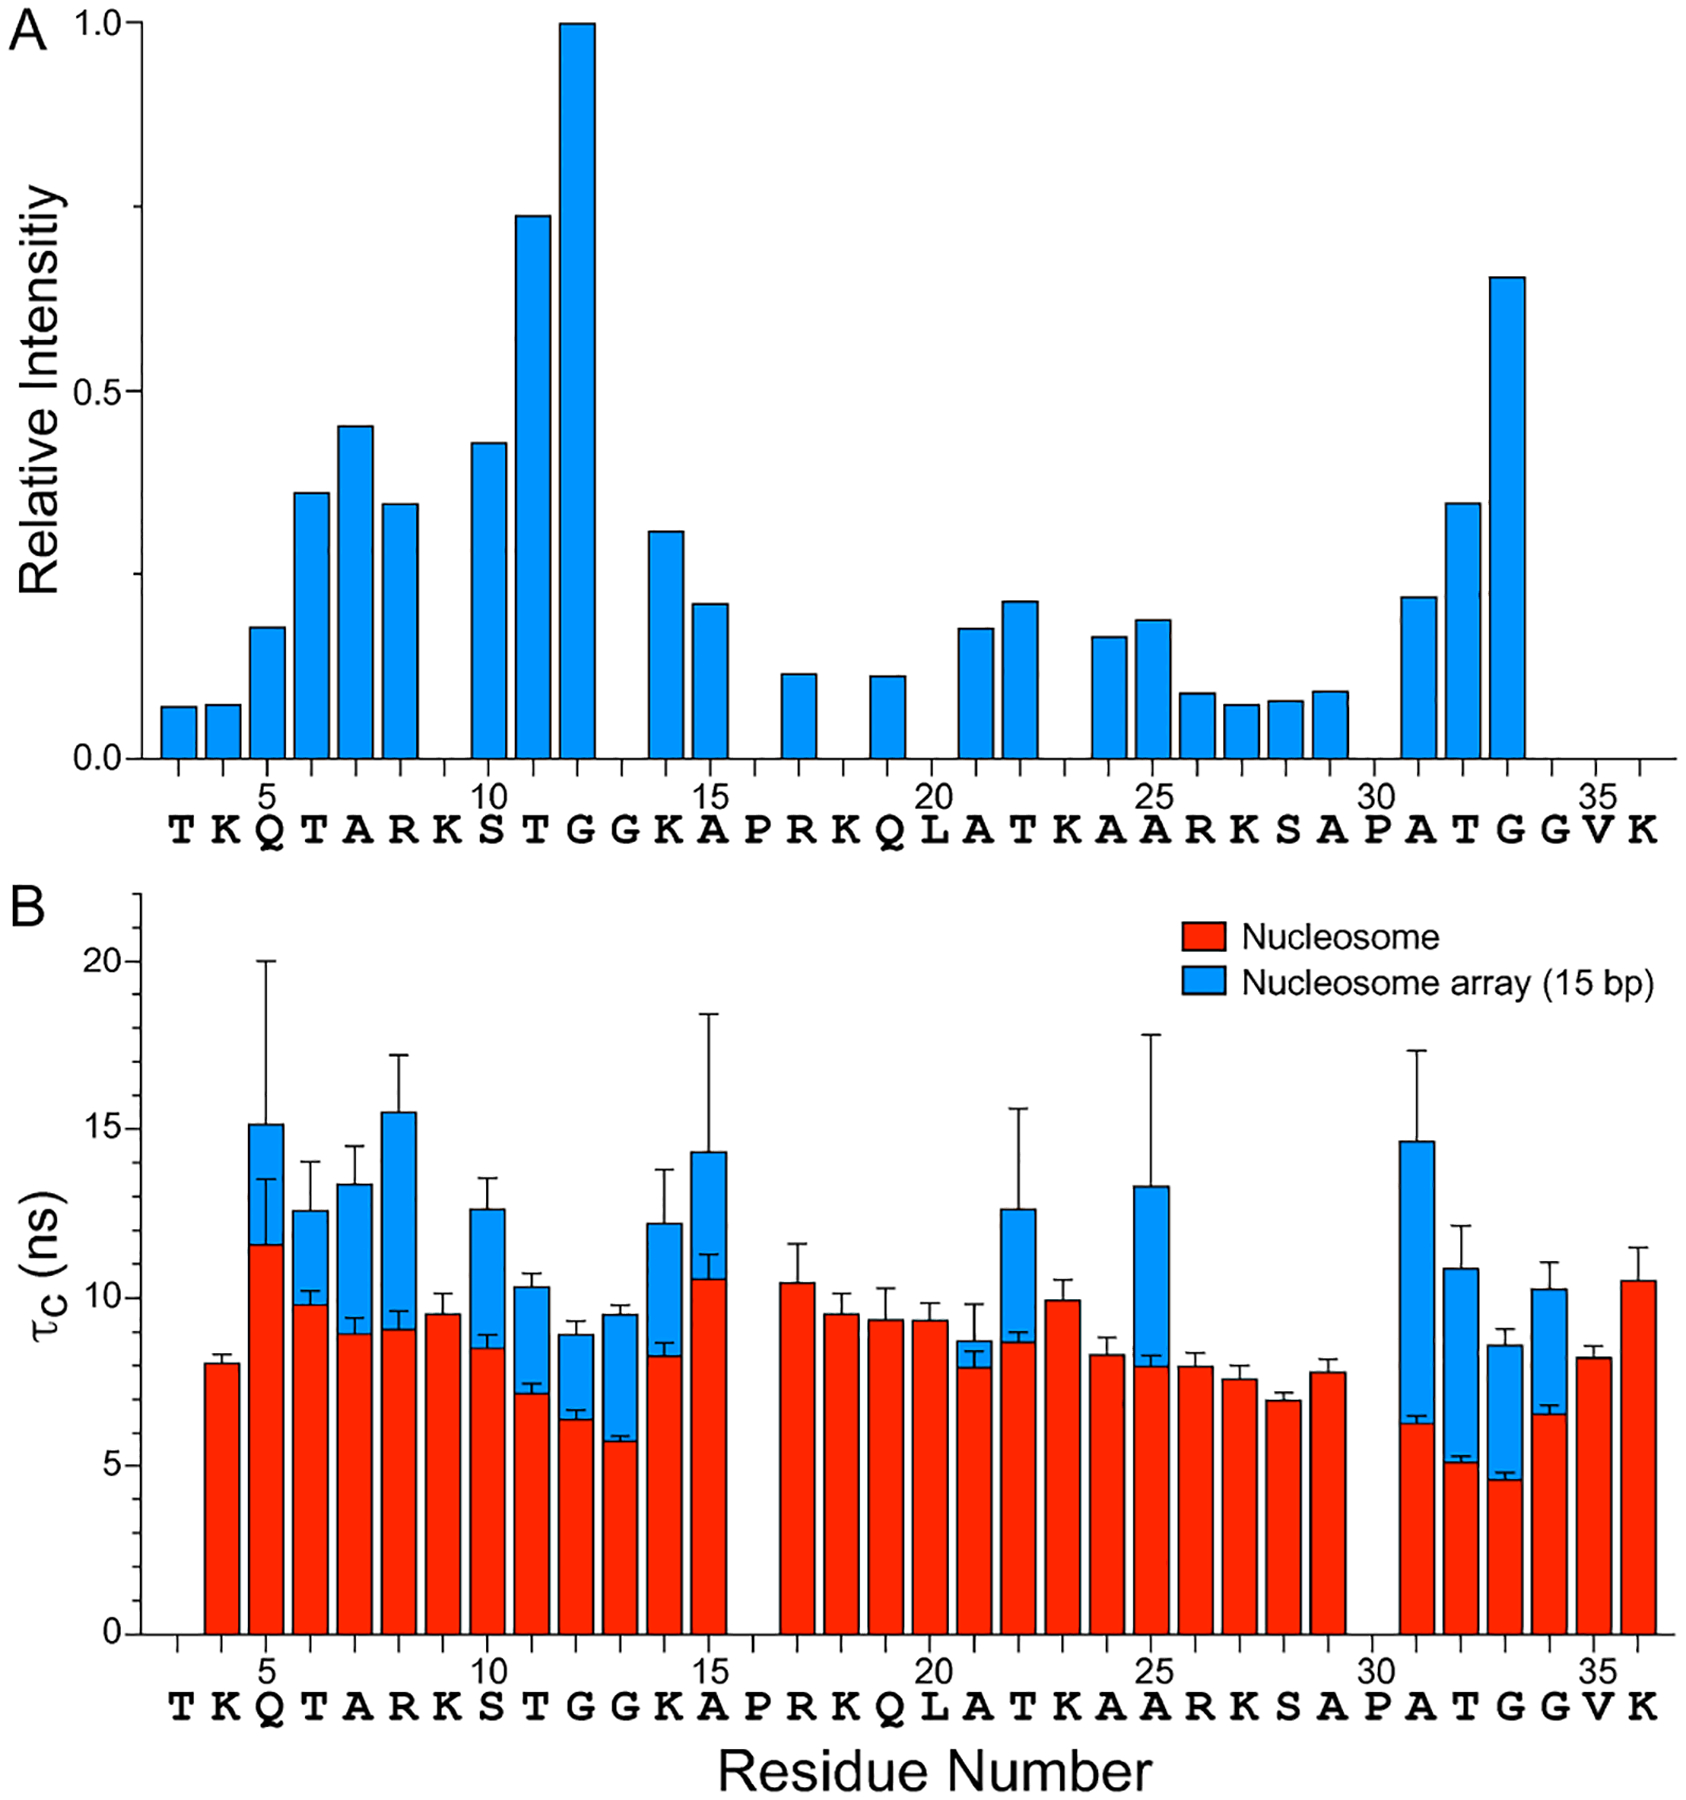
(A) Relative resonance intensities in the 15N–1H HSQC MAS NMR spectrum of histone H3 in 16-mer nucleosome arrays with 15 bp linker DNA (c.f., Figure 1E) as a function of residue number. The residue-specific resonance intensities are scaled according to the intensity for G12, and the intensities for residues K9, G13, K18, L20, K23 and G34 have been omitted due to spectral overlap which precluded the accurate extraction of resonance intensities. Nucleosome arrays with 30 and 60 bp linker DNA were found to exhibit nearly identical relative resonance intensity profiles (not shown). (B) Rotational correlation times, τc, for histone H3 tail residues in nucleosomes (red) and 16-mer nucleosome arrays with 15 bp linker DNA (blue) determined based on quantitative measurements of amide 15N R1 and R2 spin relaxation rates (SI Figure S3A,B). The τc vs. residue number profiles for nucleosome arrays with 30 and 60 bp linker DNA were found to be generally similar to the corresponding profile for the 15 bp linker DNA arrays (SI Figure S3C).