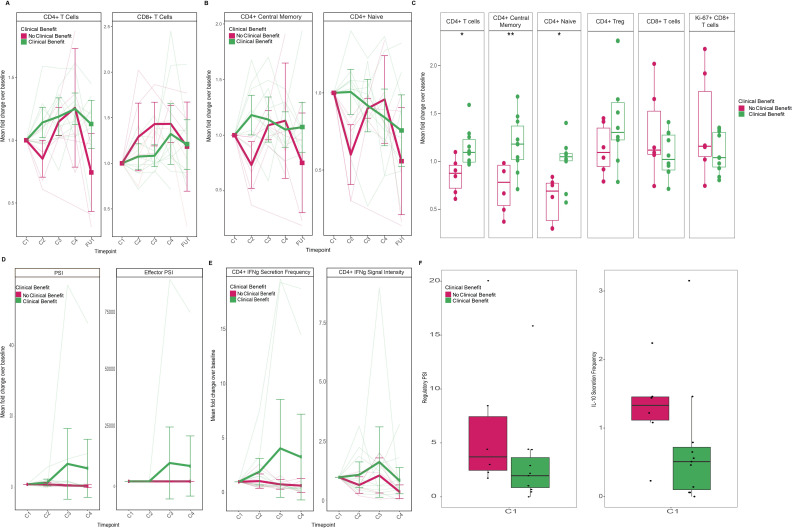
Figure 2.
Trends in peripheral immune characteristics and CB over the course of therapy. (A) Trends in CD4+ and CD8+ T cells by CB (pink denotes no CB, n=6; green denotes CB, n=10). Thick lines represent mean fold change±95% CI of group cell population over time as percent of total leukocytes; light-colored lines represent measurements of individual patients. (B) Trends in CD4+ T cells by CB. Thick lines represent mean fold change±95% CI of group cell population over time as percent of total leukocytes; light-colored lines represent measurements of individual patients. (C) Comparison of fold change from baseline in CD4+ and CD8+ T-cell populations by CB prior to cycle 2 of therapy. (D) Trends in CD4+ T-cell cytokine PSI and effector PSI by CB (pink denotes no CB, n=7; green denotes CB, n=11). Thick lines represent mean fold change±95% CI of group cell population over time as percent of total leukocytes; light-colored lines represent measurements of individual patients. (E) Trends in IFN-γ secretion frequency and signal intensity from CD4+ T cells by CB. Thick lines represent mean fold change±95% CI of group cell population over time as percent of total leukocytes; light-colored lines represent measurements of individual patients. (F) Differences in regulatory PSI and IL-10 secretion frequency and from CD4+ T cells at baseline by CB (pink denotes no CB; n=6; green denotes CB, n=11). *P<0.05, **P<0.01 by two-sided Wilcoxon rank-sum test. C1, baseline; C2, precycle 2 of therapy; C3, precycle 3 of therapy; C4, precycle 4 of therapy; CB, clinical benefit; FU1, after four cycles of therapy; IFN-γ, interferon gamma; IL, interleukin; PSI, Polyfunctional Strength Index.

