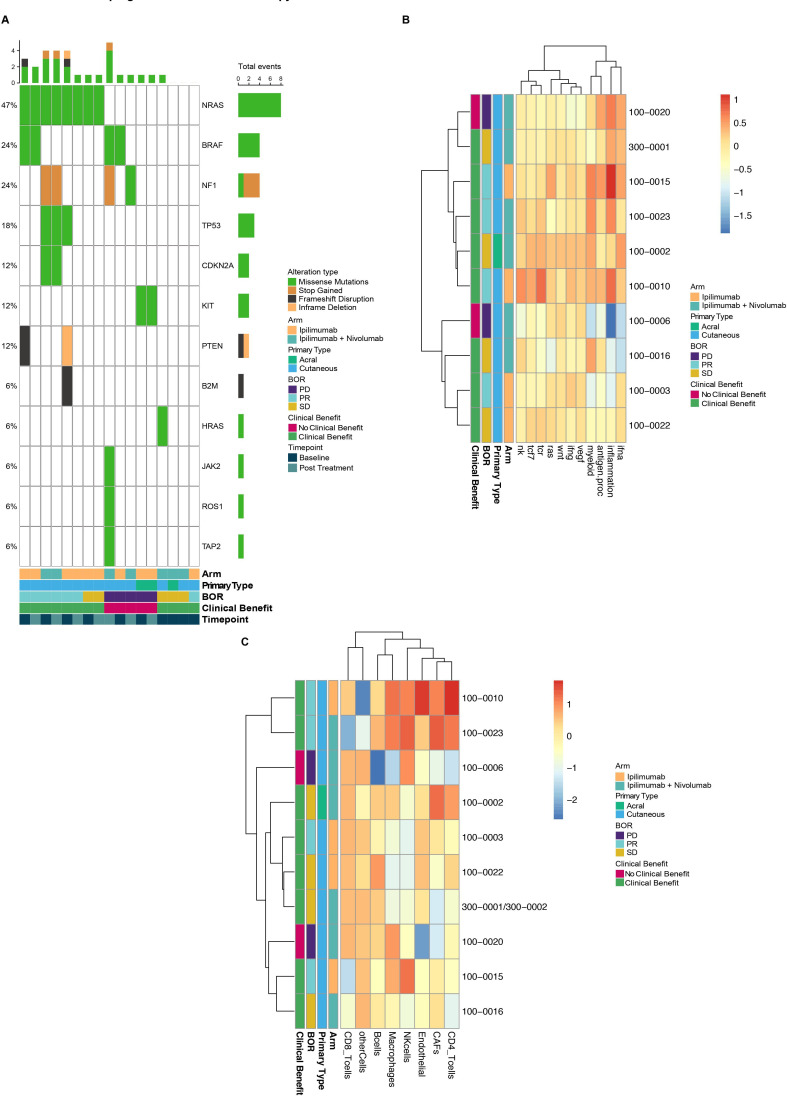
Figure 3.
Features of the tumor microenvironment in patients with melanoma treated with ipilimumab or ipilimumab plus nivolumab. (A) Mutational landscape indicating melanoma and immunotherapy-related genes with alterations in patients (n=10) at all timepoints. (B) Heatmap of expression profiling of patient tumors (n=10) by RNA sequencing at the on-treatment timepoint. The list of genes comprising each signature (heatmap columns) is detailed in online supplemental table S2. (C) Heatmap showing immune population scores calculated by EPIC deconvolution of the gene expression data for all patients with on-treatment samples sent for RNA sequencing (n=10). BOR, best overall response; CAFs, cancer associated fibroblasts; PD, progressive disease; PR, partial response; SD, stable disease.

